Experience a new perspective
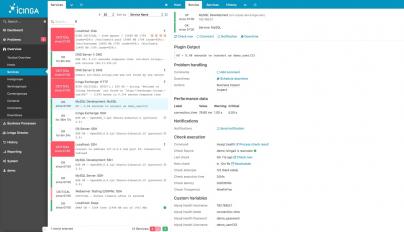
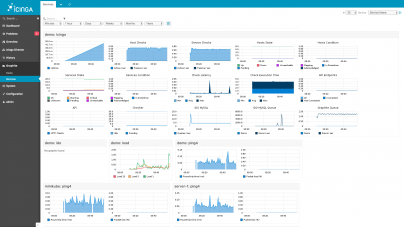
The web interface of the latest Icinga generation offers significantly higher performance than all previous solutions, supports various backends and shines with an intuitive and dynamic layout.
Custom-fit extension
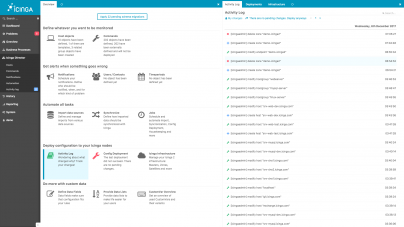
Icinga Web has a module interface that makes it easy to integrate extensions into the web interface. A large number of already existing modules can be used for Icinga Web or individually adapted to existing needs.
You decide what fits best
Icinga is characterized by a broad support of modern log, configuration and metrics solutions. So you decide for yourself which solution suits your environment best.
- Configuration - Monitoring as Code has never been easier. Use the potential of the Icinga configuration or use an existing solution. Be it Puppet, Chef, Ansible or SaltStack, no problem for Icinga.
- Log management - For medium - and long-term storage and subsequent analysis of log files, many solutions have become established on the market. Be it the Elastic Stack, Graylog or even commercial variants like Splunk. Icinga offers a variety of interfaces for connecting your environment.
- Performance & Metrics - Icinga delivers all performance data for downstream analysis to connected products. Icinga immediately provides interfaces for Graphite, InfluxDB and OpenTSDB as a core feature. Just activate the feature and off you go.

