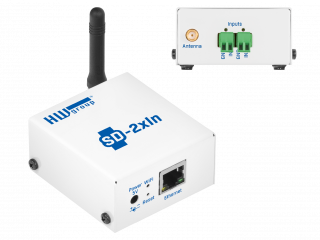
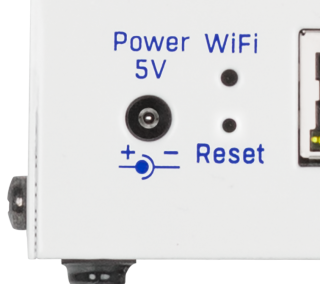
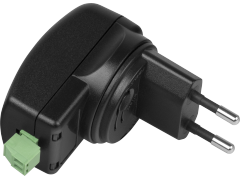
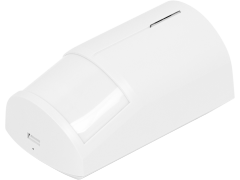
Digital Inputs for common 3rd party detectors
DI (Digital Input) for dry contact (relay output) is the most popular electrical interface for 2-state detection (doors opened/closed or water tank Full/empty).
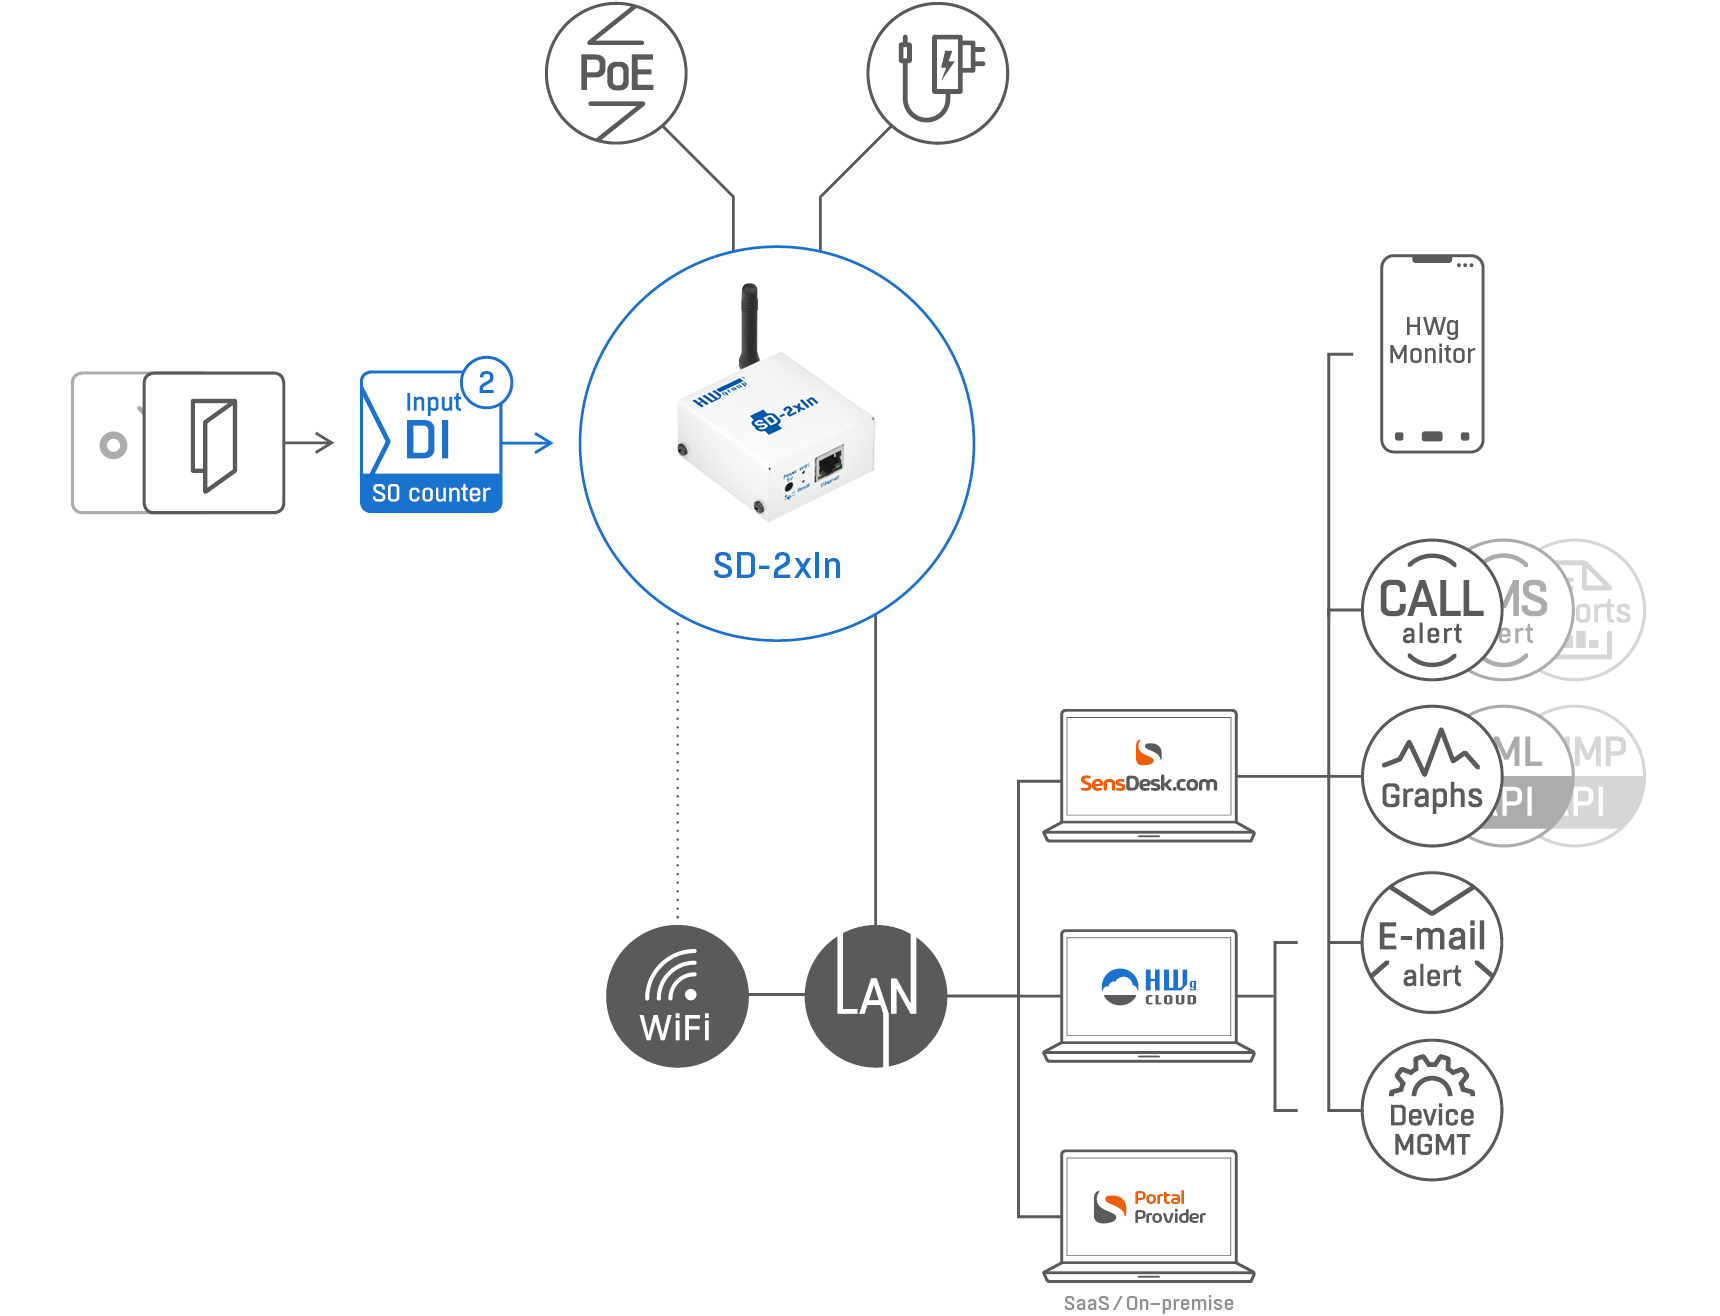
Counting pulses on DI is a useful feature enabling applications for energy/water consumption. Simply connect the water meter with pulse output to the SD-2xIn device and the water meter is monitored in the (SensDesk Technology based) Portal.
You can connect:
- Door contact
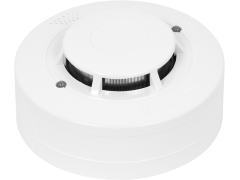
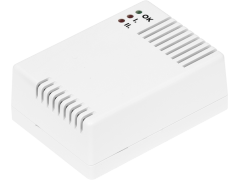
- Smoke/gas detector (relay output)
- Generic relay / Open Collector output
- Water / Gas Meter with pulse output (S0)
- Electricity Meter with pulse output (S0)
User benefits
- Device installation on the site is fast & easy even for “Junior users”.
- Portal will alert you by email (SMS, Voice Call) if DI is switched On/Off.
- Portal will alert you if the device is disconnected for 1 hour.
- Alarm state (0 / 1) can be defined for each DI
- Free cloud available (HWg-cloud.com) with graphs and device management.
- Mobile Apps can show you all detectors states in your portal account (HWg Monitor or SensDesk Mobile)
- SMS, Voice call alerts, graphs & PDF reports can be used with paid portal services.
Portal is required
All  IoT Monitoring Devices have to be connected to any SensDesk Technology-based portal (SaaS) in order to work properly.
The SensDesk Technology is a portal solution from the HW group to manage remote sensors and devices (only for HW group products). Portals offer a central overview of all the values and provide a variable combination of features like sending the alarms, reporting, history records, outputs into the Open API, etc.
There are several portals available. The manufacturer provides HWg-cloud.com and SensDesk.com, 3rd party companies provide more than 10 other portals. Users can migrate the device between any available SensDesk Technology portals.
u
HWg-cloud.com: Limited & Free portal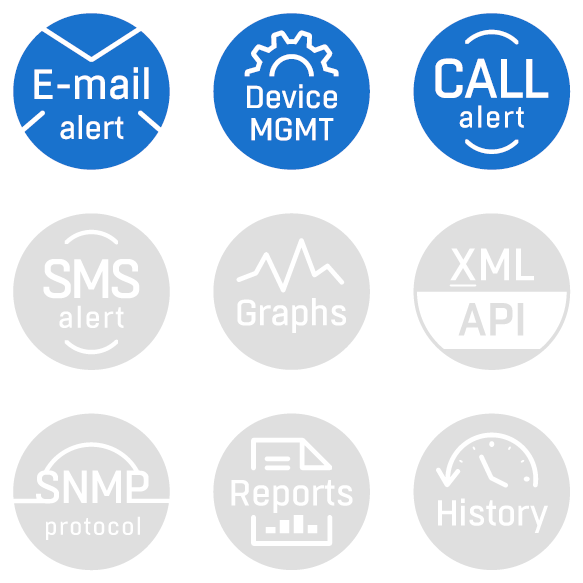
- the default pre-configured portal option
- provided by the device manufacturer
- sends email alerts and offers basic remote device management
- advanced features of SensDesk Technology are not available
- You can migrate your devices from HWg-cloud.com to any other SensDesk Technology portal at any time
SensDesk.com: Paid portal service with advanced features
- Several subscription plan options
- SMS / Voice call alerts to any mobile phone
- Graphs / MultiGraphs (data history)
- PDF reports
- Email alerts/alarm escalation
- History log
- Open API: All sensor values are available via XML / SNMP protocols
Local portals by Portal providers
- portals based on SensDesk Technology ran by 3rd party providers
- local languages and support
- various mix of free/paid services
- various commercial names
Why do you need a portal?
- Using the portal makes the IoT monitoring devices easy to install even by junior local staff. To install the IoT devices you don´t need any experts on the site.
- The portal can then send alerts, provides remote device management. Portal is one place with all your sensors & graphs overview, reporting, Open API, ...
- Even the default free of charge version of the portal (Hwg-cloud.com) can alert you by email when device disconnected / sensor value alarm.
- Price of the SensDesk.com portal service is around 15 % of the hardware cost per year.
All your sensors are in your pocket 24/7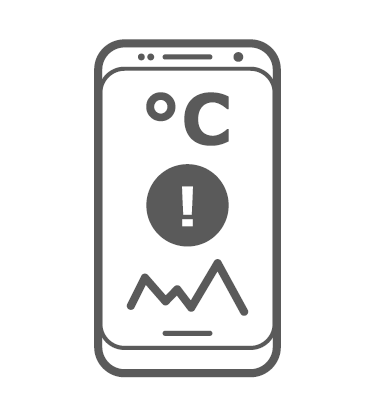
You can have a display with all your sensor values in your pocket with you 24/7. Check HWg Monitor mobile app. The app can be running on your phone, on the Android TV, or on the Tablet installed on the wall.
Alerting
SensDesk.com can immediately alert you by SMS or Voice call to your mobile phone in the case of an Alarm situation. If the time is critical, every second counts. The immediate reaction to an alarming situation can be also responded to by closing/opening a remote relay output, which can for example turn on a siren. Quick alerts lower the risk of costly damages in case of an Alarm. Alerts from the portal can escalate to higher intensity or to another person if the problem persists.
Sensor values in Multigraphs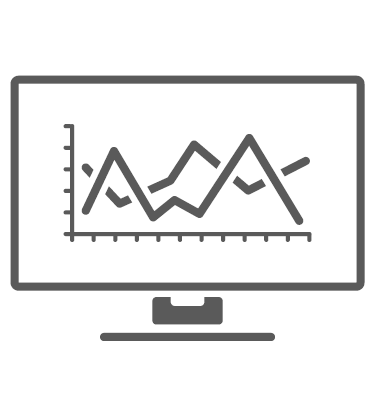
Multigraphs can display multiple sensor values from different kinds of sensors in one graph. That offers a situation overview of a remote site, significant fluctuance of sensor values is visible at first sight. It is popular for comparing time events. SensDesk.com system is also showing sensor value graphs that alert you when the device is not working or any sensor is out of defined limits.
For an example of working with charts in SensDesk, see the application note.
PDF reports
You can easily create comprehensible reports with graphical representations of sensor values in one or in a number of locations. You can create reports in PDF (CSV) periodically. Reports can be printed & clicked to the invoice for your customer. Reports for pharmaceutical / other production (HACCP) are possible.
History
Thanks to the history log you can easily compare your historical data.
Open API 
You can connect the data from SensDesk.com to any other system. Portal user account (all connected sensors) is accessible by Open API (SNMP, XML).
- A list of all the sensors / current values can be downloaded in XML format (HTTP get).
- All the values can be read via SNMP v1 / v3 protocol.
The number of Dashboards, Multigraphs and Reports is limited by the subscription plan as well as the length of the history log, check the plans: www.sensdesk.com
