HWg Monitor

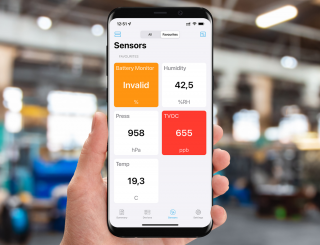
HWg Monitor is a unique mobile application for Android and iOS that allows displaying current values of sensors, inputs and outputs not only from SensDesk technology portals, but also from directly connected (WiFi/Ethernet) monitoring devices of HW group.

Note: The HWg Monitor does not support GSM/LTE devices from the Ares product family or the free HWg-cloud portal. See below

The HWg Monitor allows the user to periodically retrieve values from one or more devices of the STE2, Poseidon2, Damocles2, PWR, WLD2 and other families or periodically download and display values from the cloud servers of the HW group.

For each data source (device or portal from the Sensdesk Technology family), you can set a custom data recovery period. The application allows you to easily sort sensors by device or select preferred sensors for priority display.

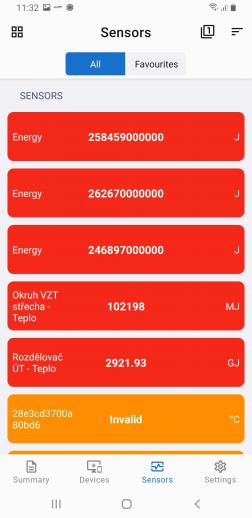
The software downloads and displays data at user-defined intervals, including the status display and its color resolution according to the criticality of the condition. Red means the sensor is in Alarm mode, yellow means the sensor is in Disconnected status. 

HWg monitor is also capable of remote control of outputs on directly connected Poseidon2 and Damocles2 units (not available for control of units connected via Sensdesk Technology portal)

Specifics of the Ares family

The HWg Monitor application does not support Ares family products in direct connection mode and can only be connected via a cloud-based solution in the form of the SensDesk Technology portal. Ares is a product using a GSM or LTE network and therefore does not include a WWW interface. 

Specifics of selected Sensdesk Technology portals

The HWg Monitor application can work with all portals from the Sensdesk Technology family, but not everyone needs to have active support for this application. The support is dependent on the XML API activation on the portal, which can be enabled or disabled by the portal operator. The HWg cloud portal has this support disabled and is only available on the paid version of Sensdesk.com. Other operators' portals may have different settings. Therefore, please ask your portal operator about application support.
 

Licence type: 
Freeware
Tested withFirmwareDateResult
2.1.6 and newest
05.2021
OK
1.4.3 and newest
1.2022
OK
3.7.5 and newest
1.2022
OK
3.7.5 and newest
01.2022
OK
3.7.5 and newest
01.2022
OK
3.7.5 and newest
1.2022
OK
3.7.5 and newest
01.2022
OK
3.7.5 and newest
01.2022
OK
3.7.5 and newest
01.2022
OK
1.3.10 and newest
01.2022
OK
2.2.2
01.2022
OK
2.0.4 and newest
01.2022
OK
2.0.4 and newest
01.1022
OK
Features: 
  • Unlimited number of monitored devices and sensors
  • Two types of data sources (Datasource) - Direct communication with unitsand o Portals (Cloud) from Sensdesk Technology family with enabled integration (API)
  • Option to select preferred sensors (favourites)
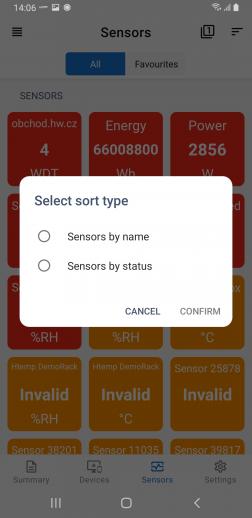
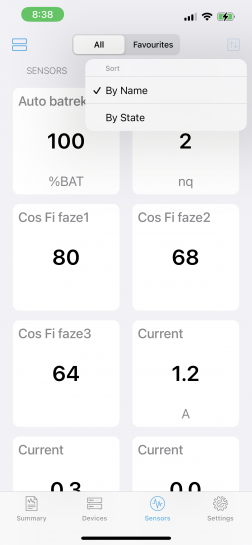
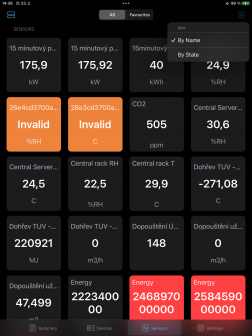
  • Select the sort type by name or state
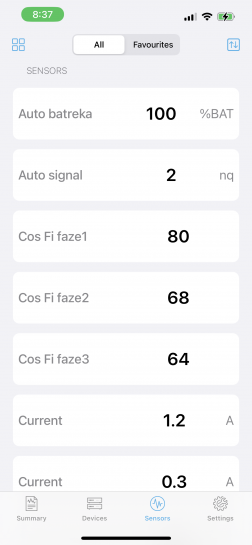
  • Row or tile display
  • Integrated HWg config for device discovery on the local network
  • Clear widget for quick preview
  • Output control on directly connected Poseidon2 and Damocles2 units
  • Clear app for iOS and Android
  • Selectable number of tiles per screen for setup needs on large screens

Horizontal menu

Detailed description of the application

The application is very simple and has 4 basic screens 

  • Summary - provides an overall view of the status of sensors and value sources (devices and portals)
  • Devices - Overview of devices with the possibility of filtering by data source
  • Sensors - overview of sensors with filtering and sorting options
  • Settings - Setting application properties and adding value sources

Summary 

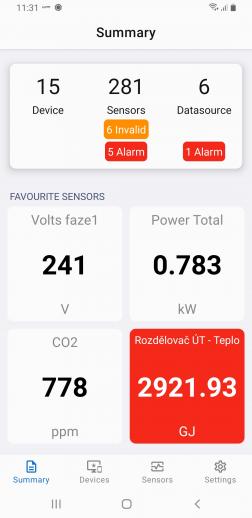
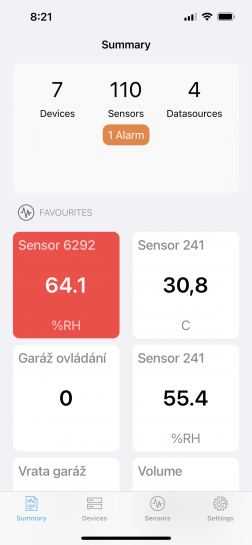
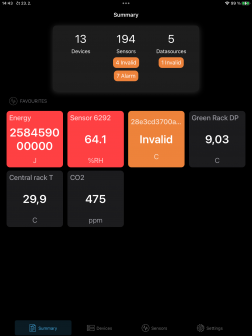
The basic view provides a quick overview of the number of monitored devices, sensors, and resources (directly monitored devices and portals). A preview of Favourite sensor values is also available. 


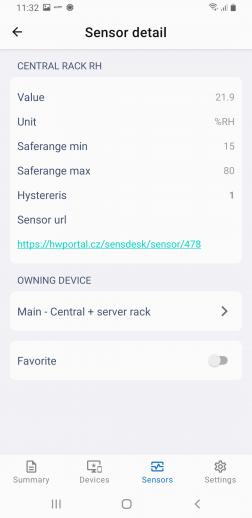
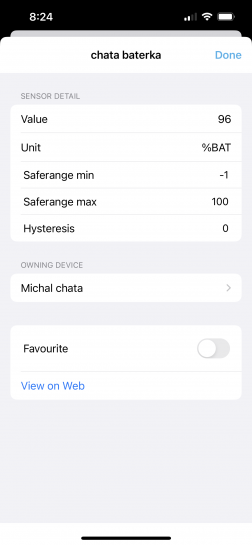
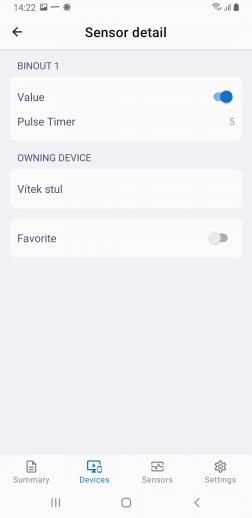
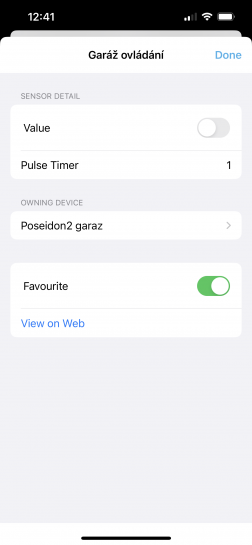
Clicking on a sensor tile opens its detail with a link to the sensor's web page on the portal in the case of cloud resources. 

Detail of the sensor in the Android environment  Detail of the sensor in the iPhone environment   Detail of the sensor in the iPAD environment

You can also add or remove a sensor from the Favourites list on this page

Devices 

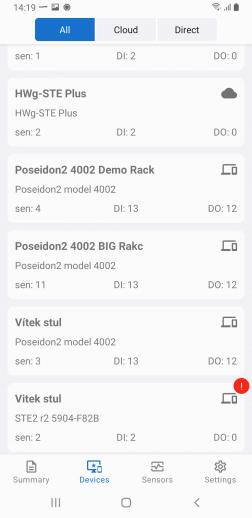
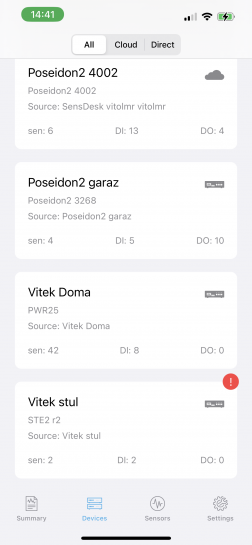
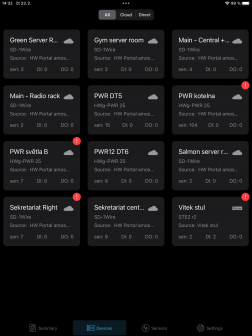
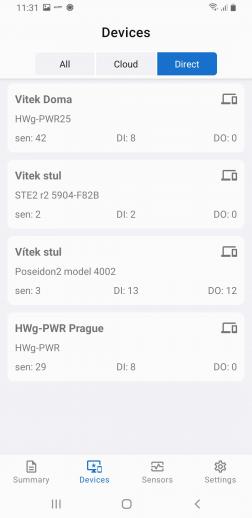
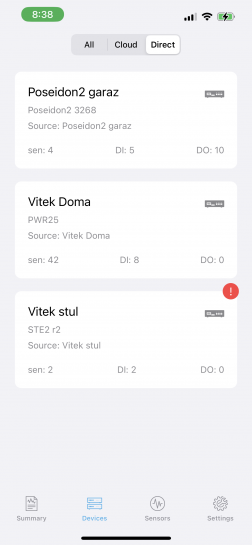
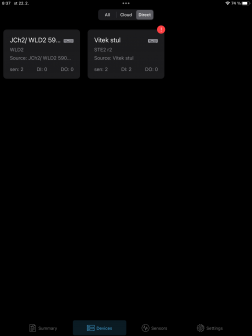
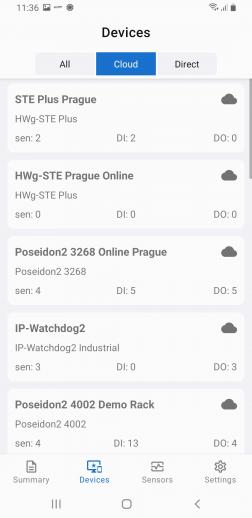
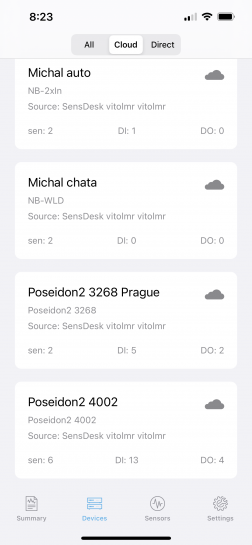
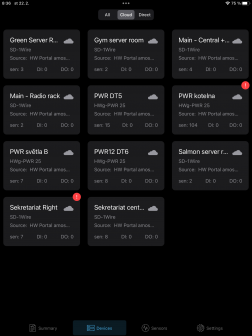
The devices page provides an overview of the monitored devices, either directly monitored or through one of the Sensdesk Technology portals.

Overview of all devices in the Android environment   Overview of all devices in the iPhone environment  Overview of all devices in the iPAD environment

The All page displays all monitored devices, and the icon in the upper right corner of each tile indicates whether it is a directly monitored device or a source originating from the cloud (Sensdesk technology portal). 

Directly monitored (end-device communication) devices in the Android environment  Directly monitored (end-device communication) devices in the iPhone environment  Directly monitored (end-device communication) devices in the iPAD environment

Indirectly monitored (communication via SensDesk Technology cloud) devices in the Android environment  Indirectly monitored (communication via SensDesk Technology cloud) devices in the iPhone environment   Indirectly monitored (communication via SensDesk Technology cloud) devices in the iPAD environment

A red symbol also appears in the top right corner as a sign of a problem on the device, whether it is a sensor invalid or an Alarm. Clicking on a device tile will open its detail. 

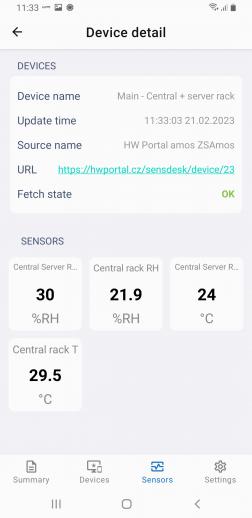
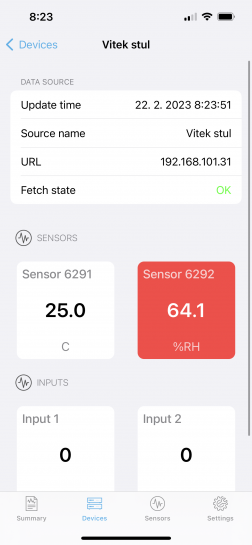
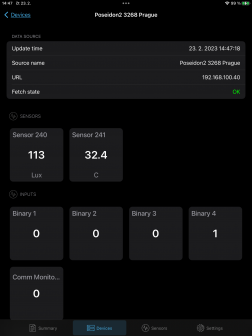
View device detail in the Android environment. The detail contains information about the device and an overview of its sensors, inputs and outputs  View device detail in the iPhone environment. The detail contains information about the device and an overview of its sensors, inputs and outputs  View device detail in the iPAD environment. The detail contains information about the device and an overview of its sensors, inputs and outputs

In the details, the values are categorized into sensors, inputs and outputs and there is also a link to the device's WWW page. Clicking on a sensor tile again opens its detail with a link to the sensor's web page on the portal in the case of cloud resources or to the device web (in the case of sensors on directly monitored devices). 

Sensors

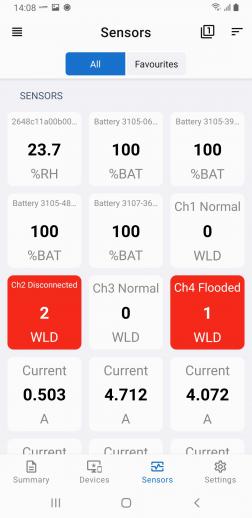
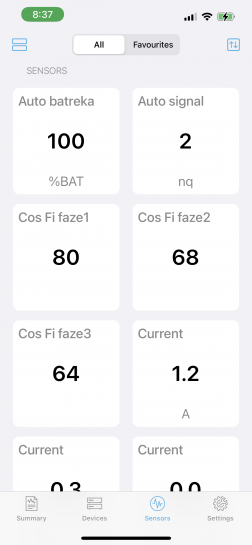
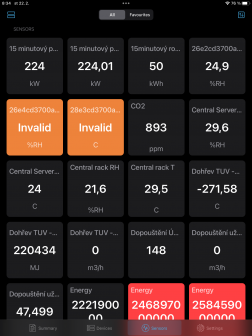
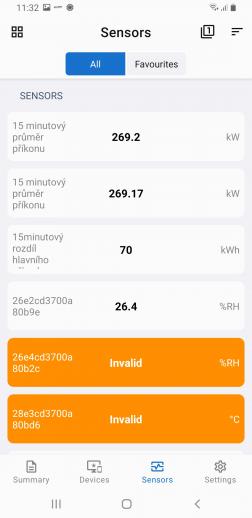
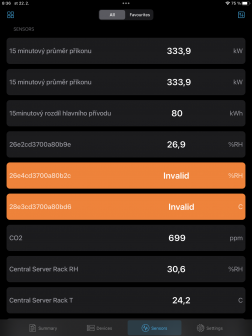
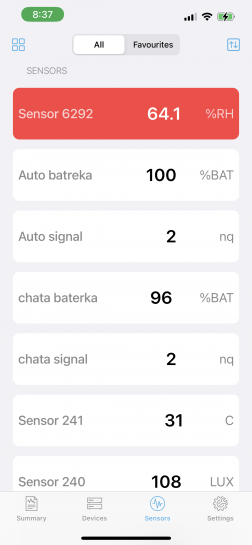
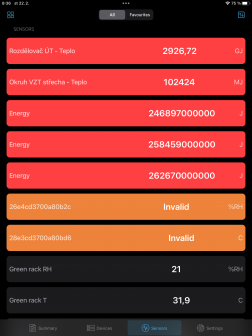
The sensors page presents an overview of the sensors monitored. Either in line or tile view. The default view is tiles sorted by sensor name. 

An overview of all sensors sorted by name in a tile view. Android environment  An overview of all sensors sorted by name in a tile view. iPhone environment  An overview of all sensors sorted by name in a tile view. iPAD environment

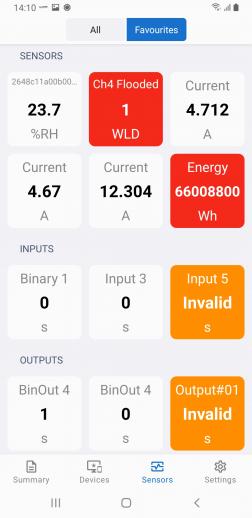
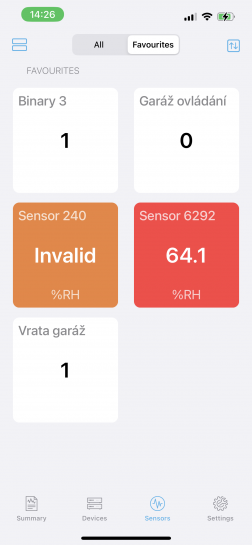
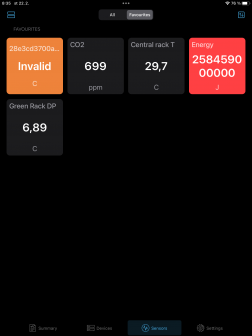
You can display either all sensors or just the favourite ones

Overview of Favourites sensors sorted by name in tile view. Android environment  Overview of Favourites sensors sorted by name in tile view. iPhone environment  Overview of Favourites sensors sorted by name in tile view. iPAD environment

Click in the top right corner to adjust the sensor order

Switch between row and tile view on Android Switch between row and tile view on iPhone Switch between row and tile view on iPAD

Click in the upper left year to switch the view to line

Line display of values sorted by name in the middle Android Line display of values sorted by name in the middle iPhone Line display of values sorted by name in the middle iPad

And of course you can also change the sorting by state or sensor name here

Line display of values sorted by sensor status in the middle Android Line display of values sorted by sensor status in the middle iPhone Line display of values sorted by sensor status in the middle iPad

You can also select the size of the tiles in the tile view to customize the view to suit your needs: 

The size of the tiles can be changed for clarity. Here is an example of a 1-column view in Android The size of the tiles can be changed for clarity. Here is an example of a 2-column view in Android The size of the tiles can be changed for clarity. Here is an example of a 3-column view in Android The size of the tiles can be changed for clarity. Here is an example of a 4-column view in Android

The size of the tiles can be changed for clarity. Here is an example of a 1-column view in iPhone The size of the tiles can be changed for clarity. Here is an example of a 2-column view in iPhone The size of the tiles can be changed for clarity. Here is an example of a 3-column view in iPhone

The size of the tiles can be changed for clarity. Here is an example of a 1-column view in iPad The size of the tiles can be changed for clarity. Here is an example of a 2-column view in iPad The size of the tiles can be changed for clarity. Here is an example of a 4-column view in iPad The size of the tiles can be changed for clarity. Here is an example of a 7-column view in iPad

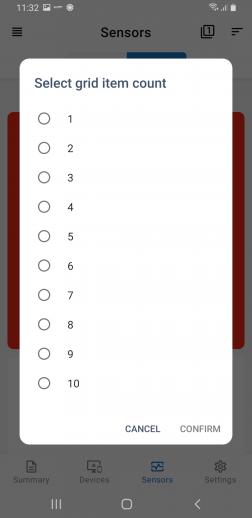
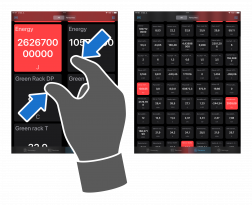
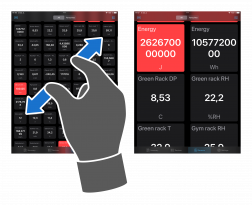
The way of switching is different for Android and iOS versions where the iOS version uses two-finger zoom, the Android version has a button in the top right corner.

Setting the grid coarseness (number of columns) in Android  Zooming in and out of the tile grid in the IoS environment is done by swiping with your fingers Zooming in and out of the tile grid in the IoS environment is done by swiping with your fingers

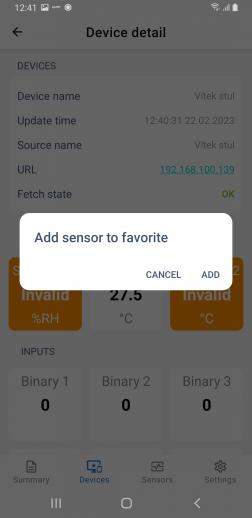
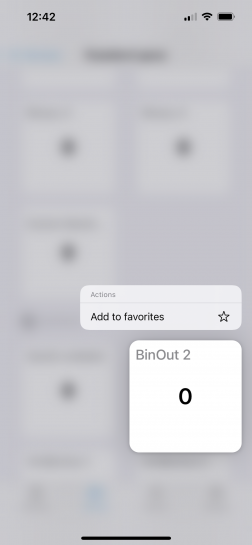
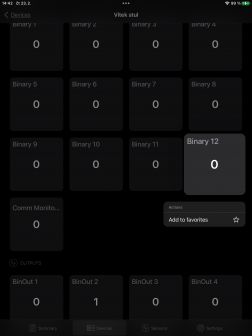
Holding down a tile or sensor row will bring up a quick option to add the value to your favourites.
Adding a sensor to the favorites is easily done by holding down the appropriate value and selecting Add to Davourites in the context menu Adding a sensor to the favorites is easily done by holding down the appropriate value and selecting Add to Davourites in the context menu Adding a sensor to the favorites is easily done by holding down the appropriate value and selecting Add to Davourites in the context menu

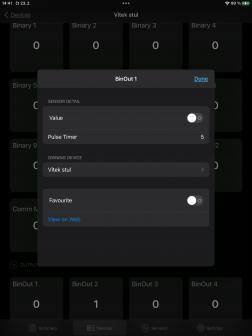
A special feature is the control of outputs. The output control action can be performed only on the output detail (by clicking on a tile or row of a specific output).

A special feature is the control of outputs. The output control action can be performed only on the output detail (by clicking on a tile or row of a specific output) A special feature is the control of outputs. The output control action can be performed only on the output detail (by clicking on a tile or row of a specific output) A special feature is the control of outputs. The output control action can be performed only on the output detail (by clicking on a tile or row of a specific output)

In this case, the output value is not expressed as a number, but as a slider. If the slider is on the left (white), the output is off, if on the right (blue or green), it is on. Inactive (gray) means that the output on the device is controlled by a local condition and cannot be changed from the application. If the Pulse Timer function is applied to the output on the device, the pulse length is indicated in the appropriate field in the HWg monitor as well, and the slide then only activates the Pulse Timer on the device. WARNING: If Pulse Timer is active, the HWg monitor may show an incorrect value until the updated values are retrieved from the source!

Settings

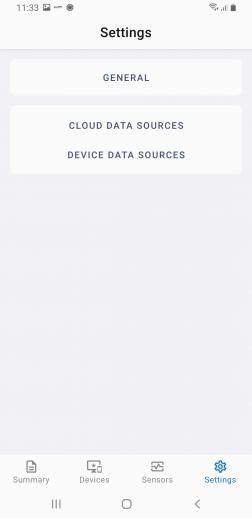
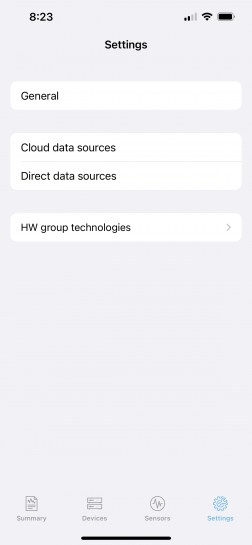
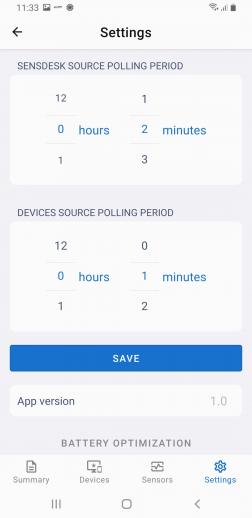
The settings page is used to add sources of values and set the source reading period.

The settings page is used to add sources of values and set the source reading period - Android The settings page is used to add sources of values and set the source reading period - iPhone The settings page is used to add sources of values and set the source reading period - the iPad shares the Settings page with the General subpage

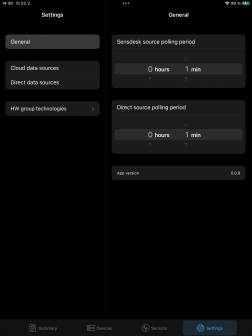
Thanks to the wide screen, the iPad shares the Settings page with the General subpage.

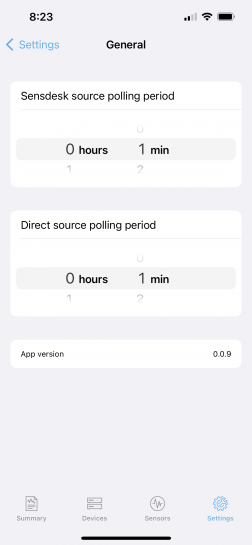
General in Android system is used to set the resource reading period. General in iPhone system is used to set the resource reading period. General in iPad system is used to set the resource reading period.

General is used to set the resource reading period. The highest frequency is 1 minute but considering the load of resources and the real speed of change of values we recommend times not shorter than 5 minutes.
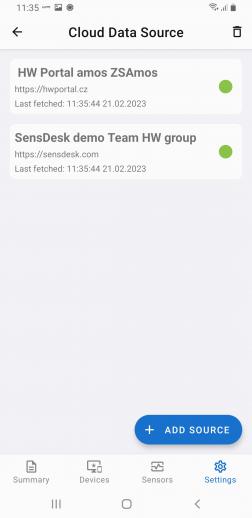
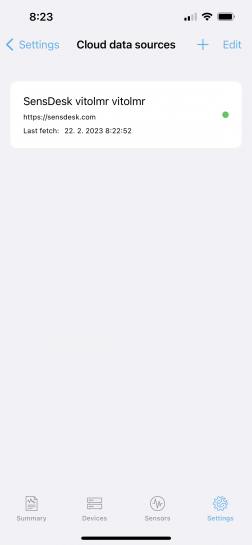
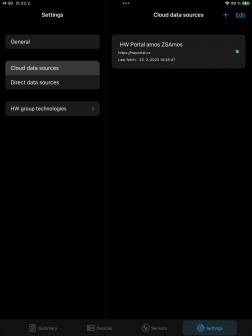
Overview of monitored SensDesk Technology portal data sources in the Android environment Overview of monitored SensDesk Technology portal data sources in the iPhone environment Overview of monitored SensDesk Technology portal data sources in the iPad environment

Cloud data source is used to add SensdeskTechnology portals as sources of value. Sources can be added either by using the + or +Add Source button, or by using a link on the portal website - For more information, see the chapter Add a portal SensDesk Technology to HWg monitor by one click. A colored dot next to each source indicates its status - green communication is OK, red, the source is not communicating.

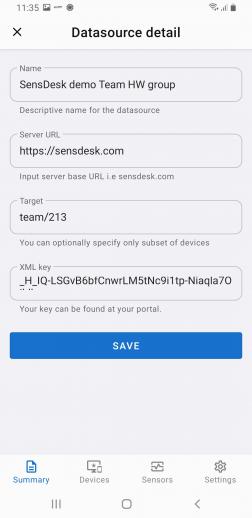
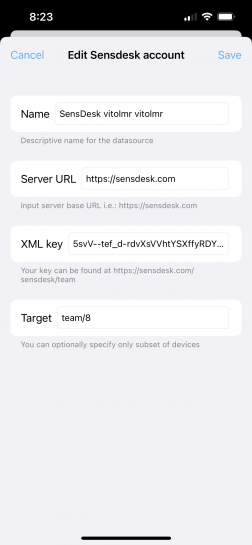
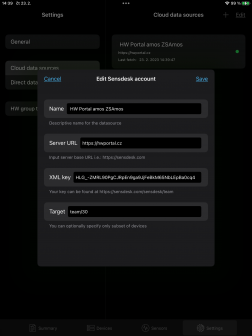
Setup and data source editing page from the SensDesk Technology portal in the Android environment Setup and data source editing page from the SensDesk Technology portal in the iPhone environment Setup and data source editing page from the SensDesk Technology portal in the iPAD environment

To manually add a portal, you need to name the value source (Name), enter the portal URL (or IP address or domain name), the desired target (the target can be the values of the whole Team, dashboard or multigraph) and the XML key. All required information can be found in your Sensdesk Technology family portal account settings, but we strongly recommend that you add sources using the link on the portal site - see the Add a portal SensDesk Technology to HWg monitor by one click section for more information.

Adding directly monitored sources (devices are done in Settings => Direct source).

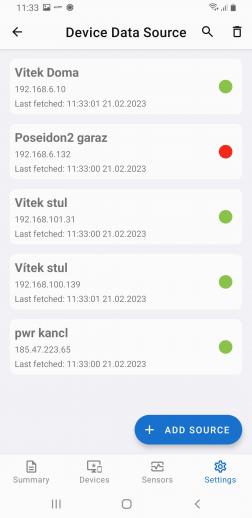
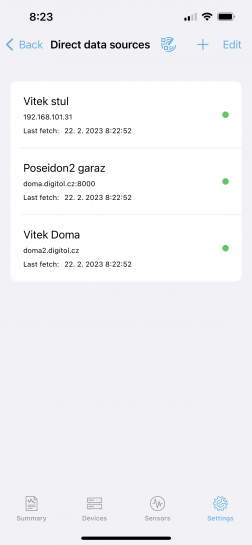
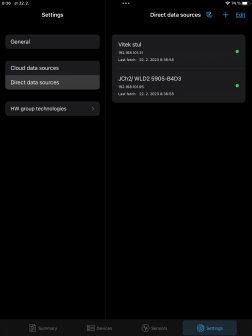
Overview of directly monitored data sources (end devices) in the Android environment Overview of directly monitored data sources (end devices) in the iPhone environment Overview of directly monitored data sources (end devices) in the iPAD environment

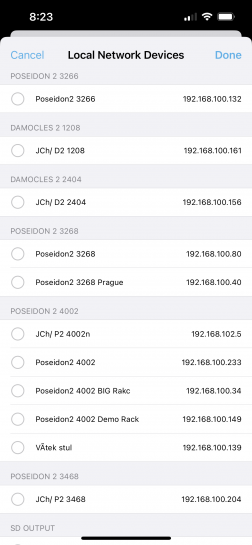
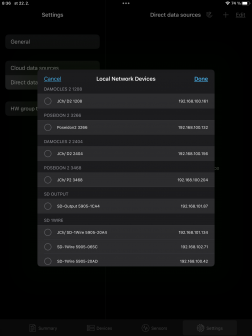
Again, a complete overview of connected sources is available with the source status indicated (green communication is OK, red, the source is not communicating), but in addition to the option of manual addition, there is also a local network scan function (may not work on all devices and versions). 

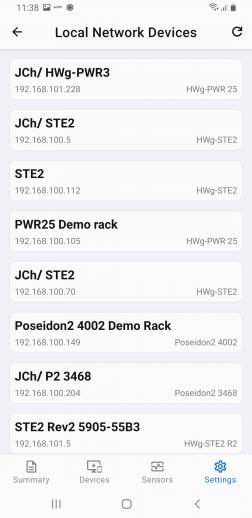
Search for HW group devices on a local network using the HWg search feature on an Android phone Search for HW group devices on a local network using the HWg search feature on an iPhone Search for HW group devices on a local network using the HWg search feature on an iPad tablet

Clicking on the magnifying glass or the Grid icon will start the search algorithm. By clicking on the selected device, it can be added to the list of monitored devices. For iOS versions, it is possible to add multiple devices simultaneously. For Android versions, you must add devices individually.
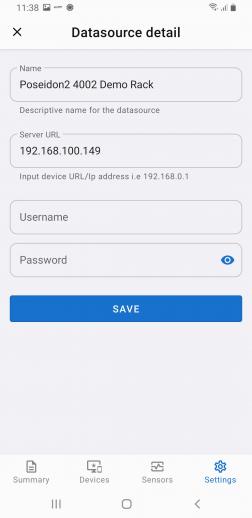
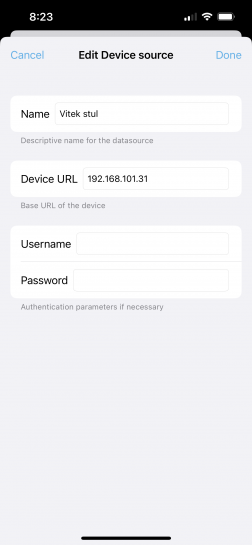
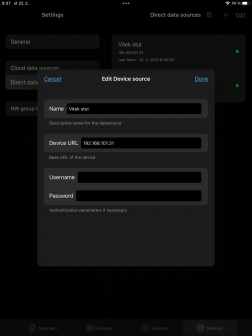
Page with detailed settings and editing of directly monitored data sources (devices) in the Android environment Page with detailed settings and editing of directly monitored data sources (devices) in the iPhone environment Page with detailed settings and editing of directly monitored data sources (devices) in the iPad environment

When manually adding or editing a source, there is also an option to enter the username and password for the device. If you want to control outputs on the device, a username and password with Read and Write or Read and Output permissions must be used. Read only is sufficient to simply detect values.
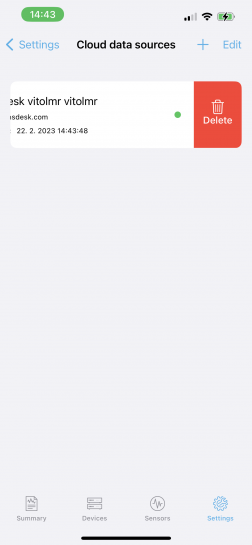
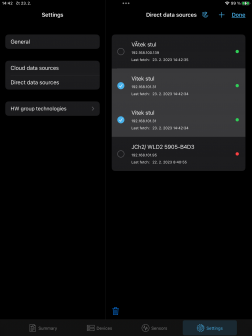
Deleting directly monitored data sources (devices) in the Android environment Deleting directly monitored data sources (devices) in the iPhone environment Deleting directly monitored data sources (devices) in the iPad environment

Deleting sources can be done in bulk on the Settings => Direct data sources or Cloud data sources pages using the Edit option in the upper left corner. This will allow the selection of sources and a delete button will be available at the bottom of the screen.  In iOS versions, it is also possible to delete sources individually by swiping left.
Widgets

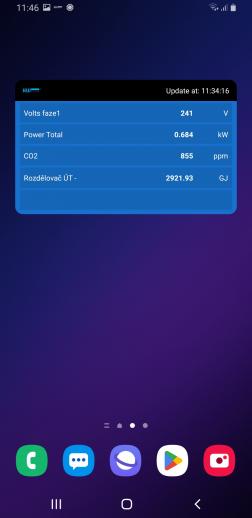
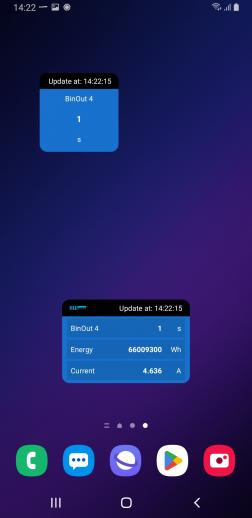
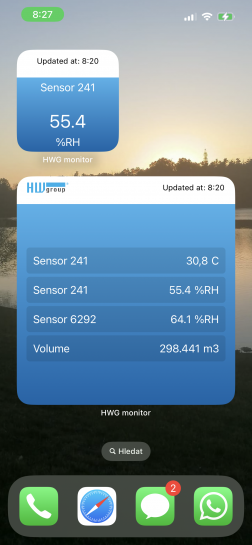
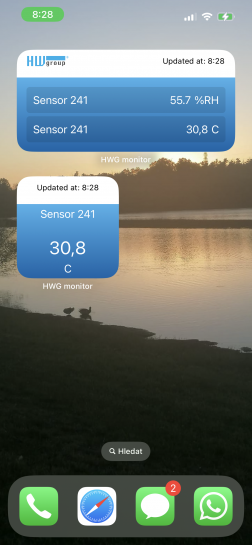
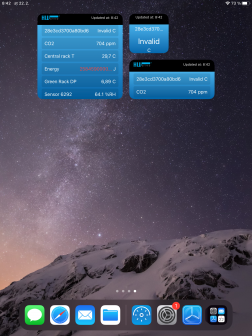
The app has a trio of widgets that you can add to your phone screen. The widgets only show sensors from the favourites group and cannot be filtered further,

App widgets with a quick view of Favourites sensor values in the Android environment App widgets with a quick view of Favourites sensor values in the Android environment App widgets with a quick view of Favourites sensor values in the iPhone environment App widgets with a quick view of Favourites sensor values in the iPhone environment App widgets with a quick view of Favourites sensor values in the iPad environment

So you can't specify which specific sensor will be on the small widget, it will always be the first one of the favorites.