What is Node-RED
Node-RED is a low-code development tool for visual programming that is flow-based and designed to wire together hardware devices, APIs and online services.
It provides a web browser-based flow editor to create JavaScript functions and allows users to save or share individual elements of their applications. The runtime of Node-RED is built on Node.js and the flows are stored using JSON. It can run locally, on a Raspberry Pi, or on Android, in the cloud, and on various other platforms (For further information, visit: https://nodered.org).
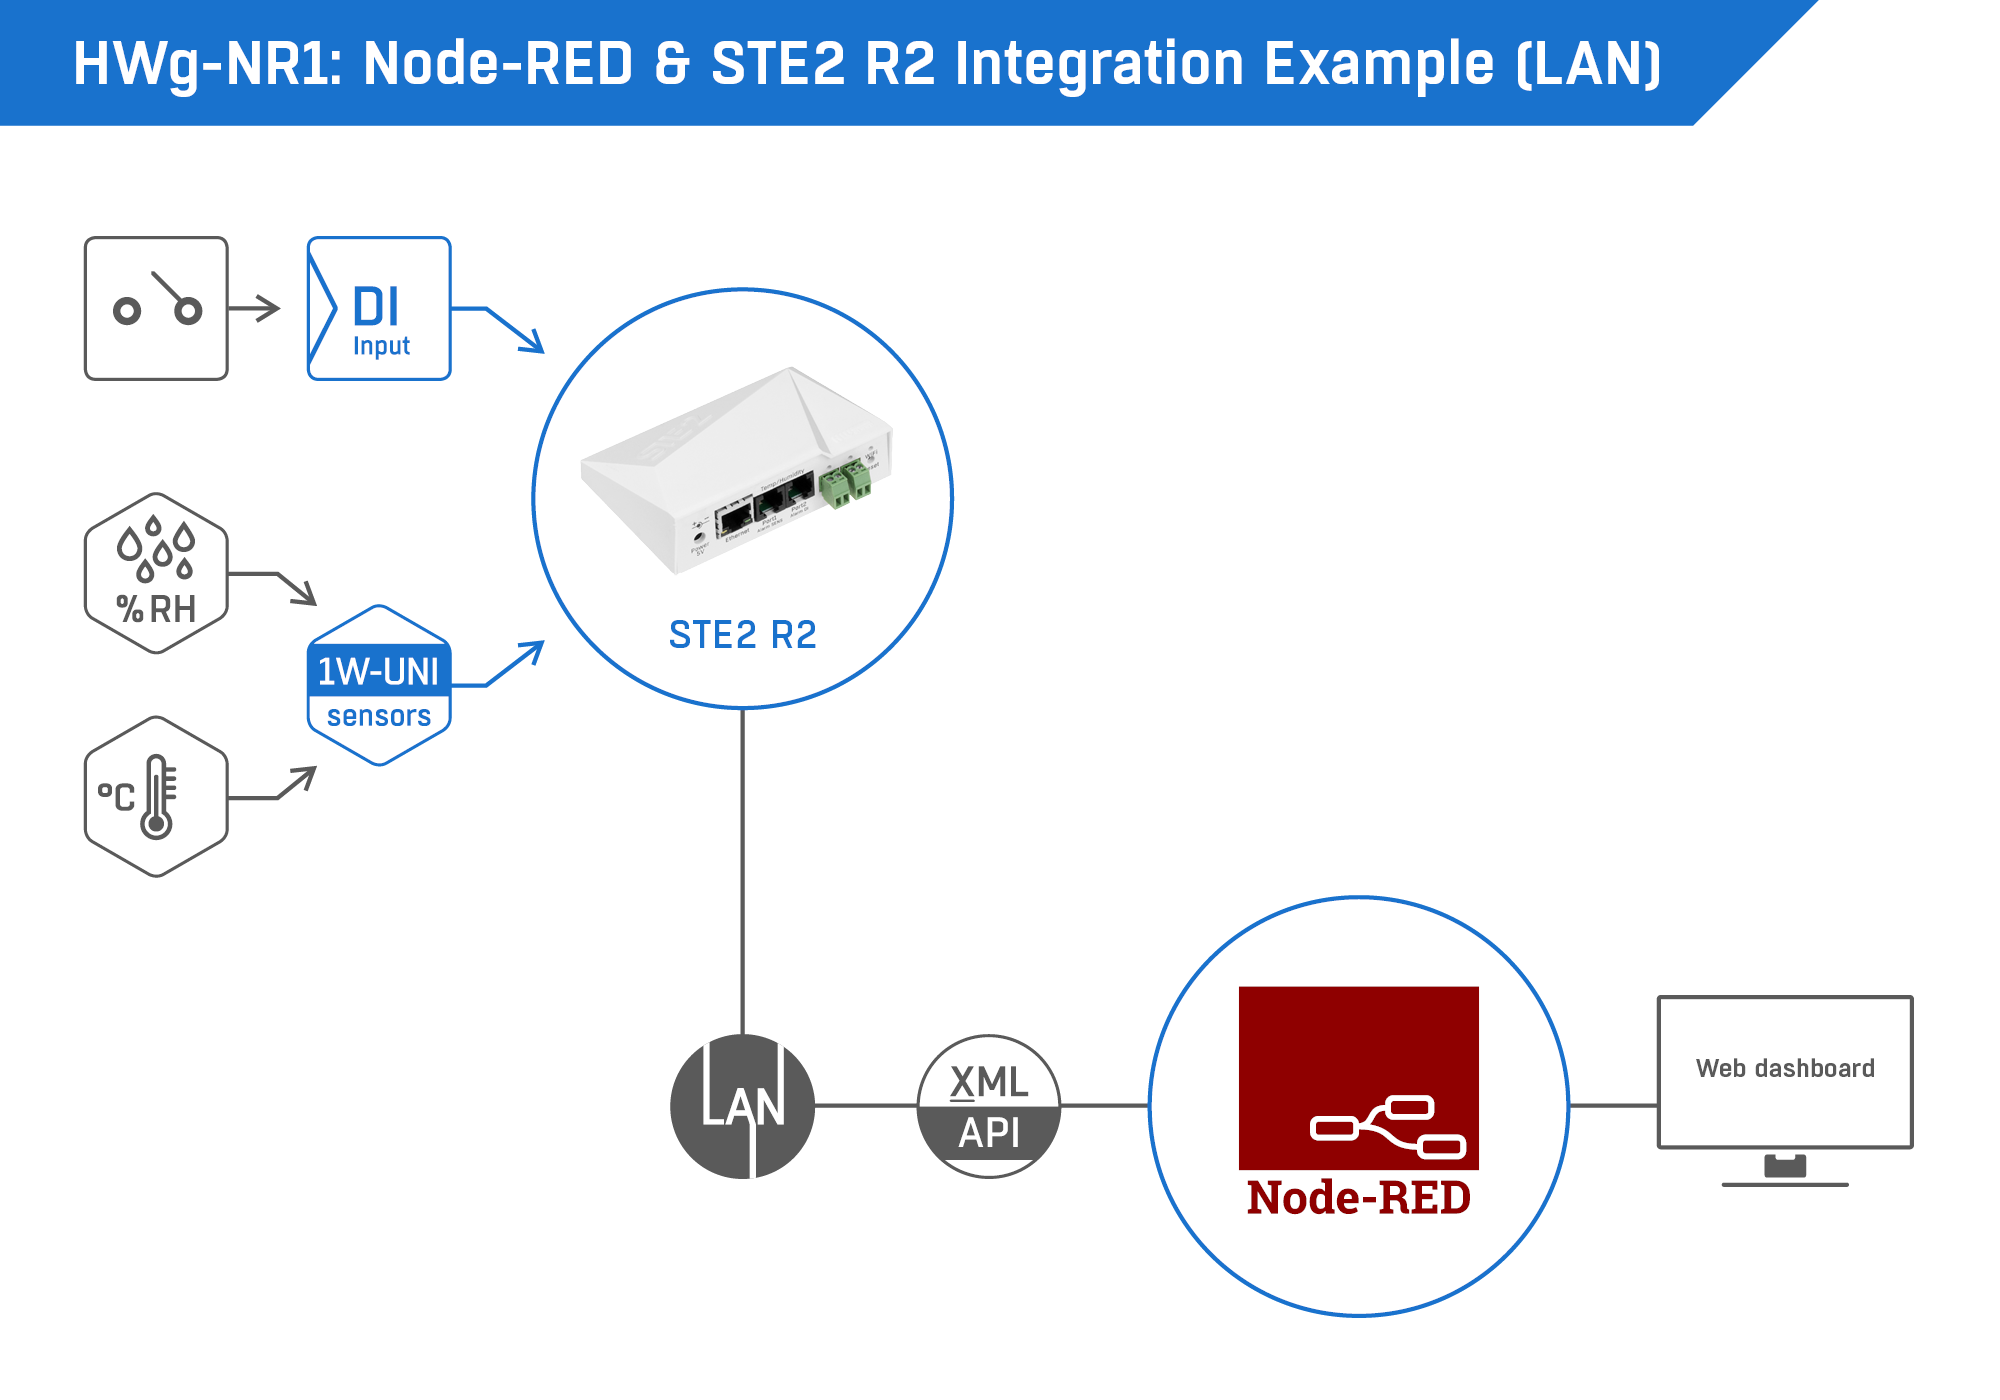
The HWg-NR1 Node-RED Project
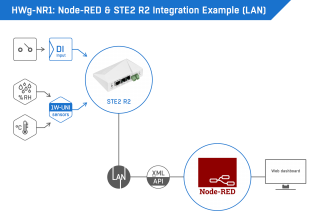
- Fetches data via LAN;
- Uses HTTP and XML API for communication;
- Uses Node-RED;
- Outputs the data via a web dashboard;
- Dashboard can display 4 user-selected sensors or digital inputs;
- You can add additional sensors or digital inputs to the dashboard manually;
- The project is compatible with PC, Raspberry Pi, and cloud platforms.
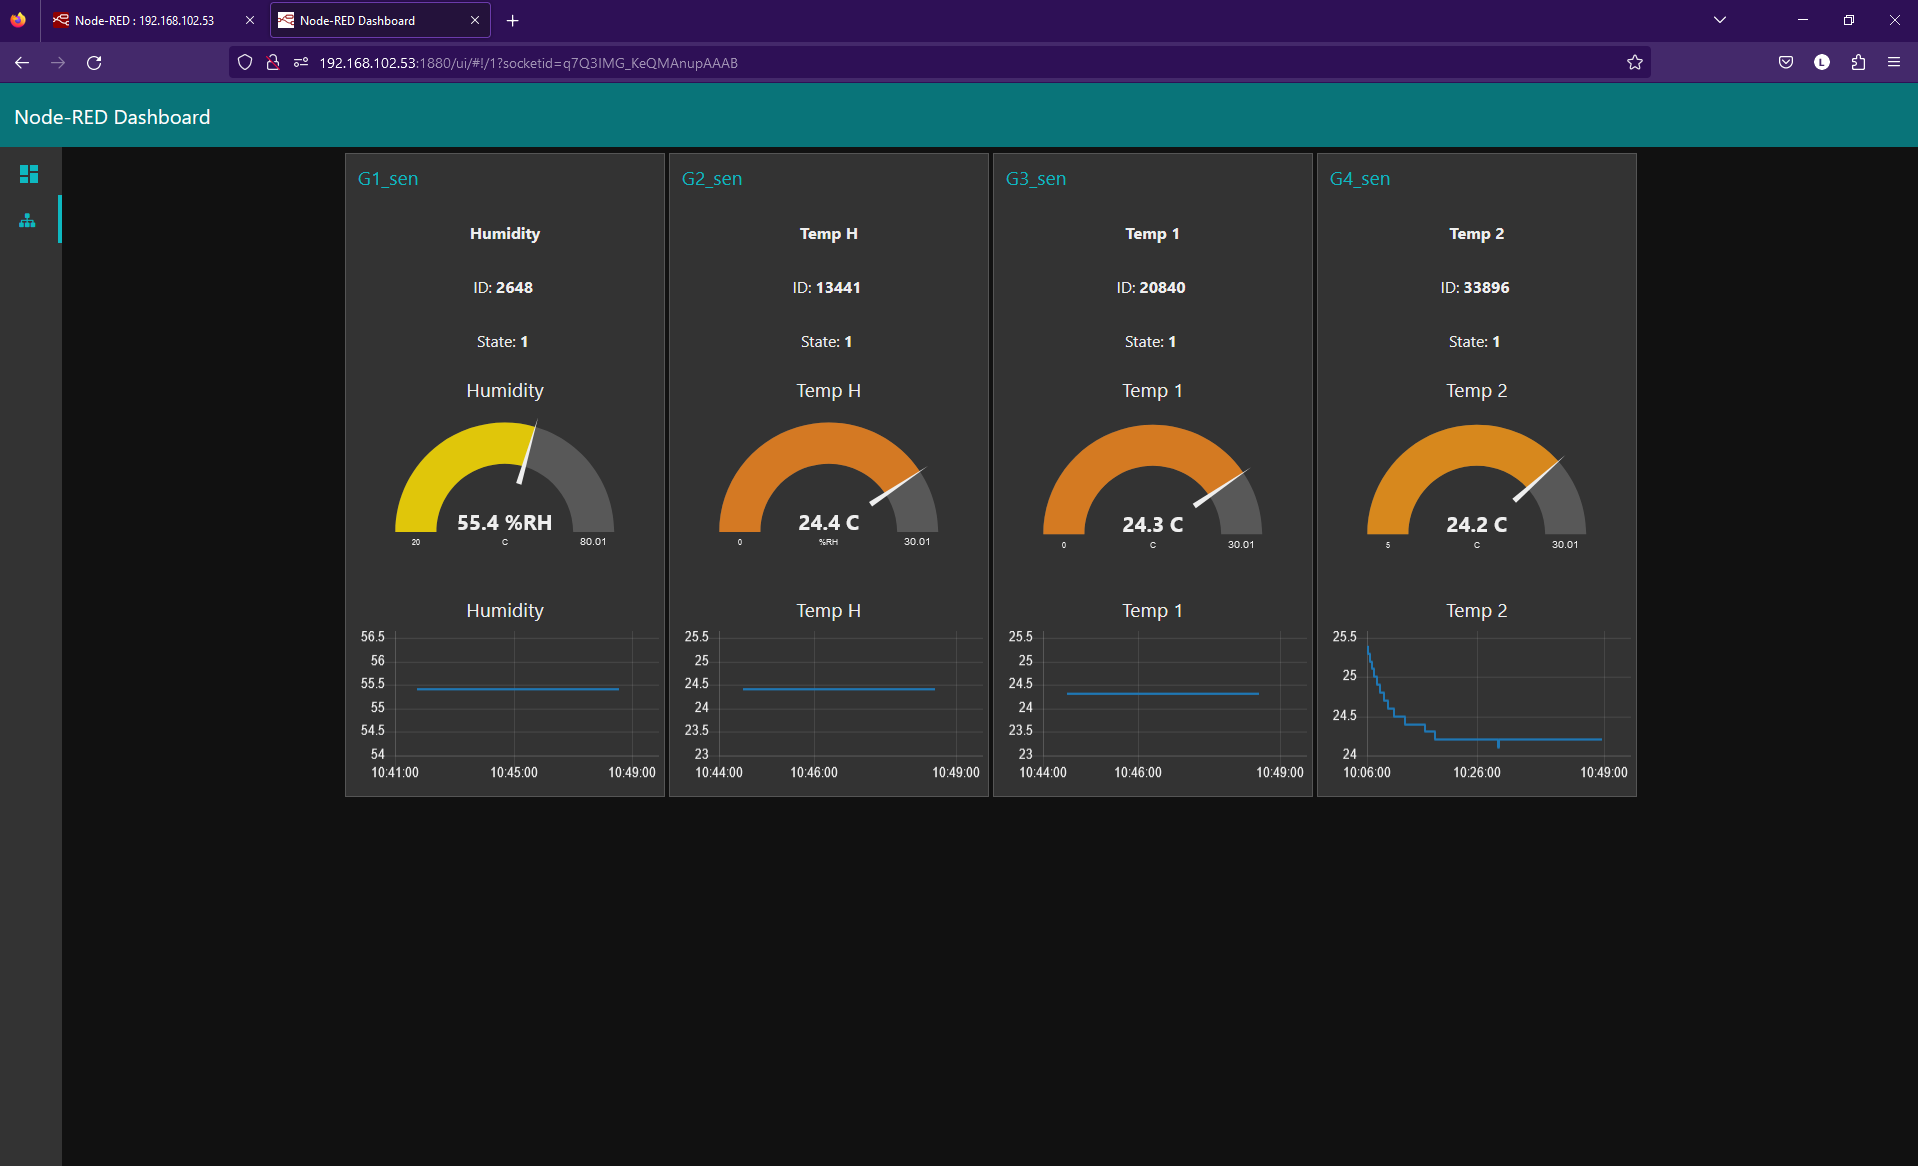
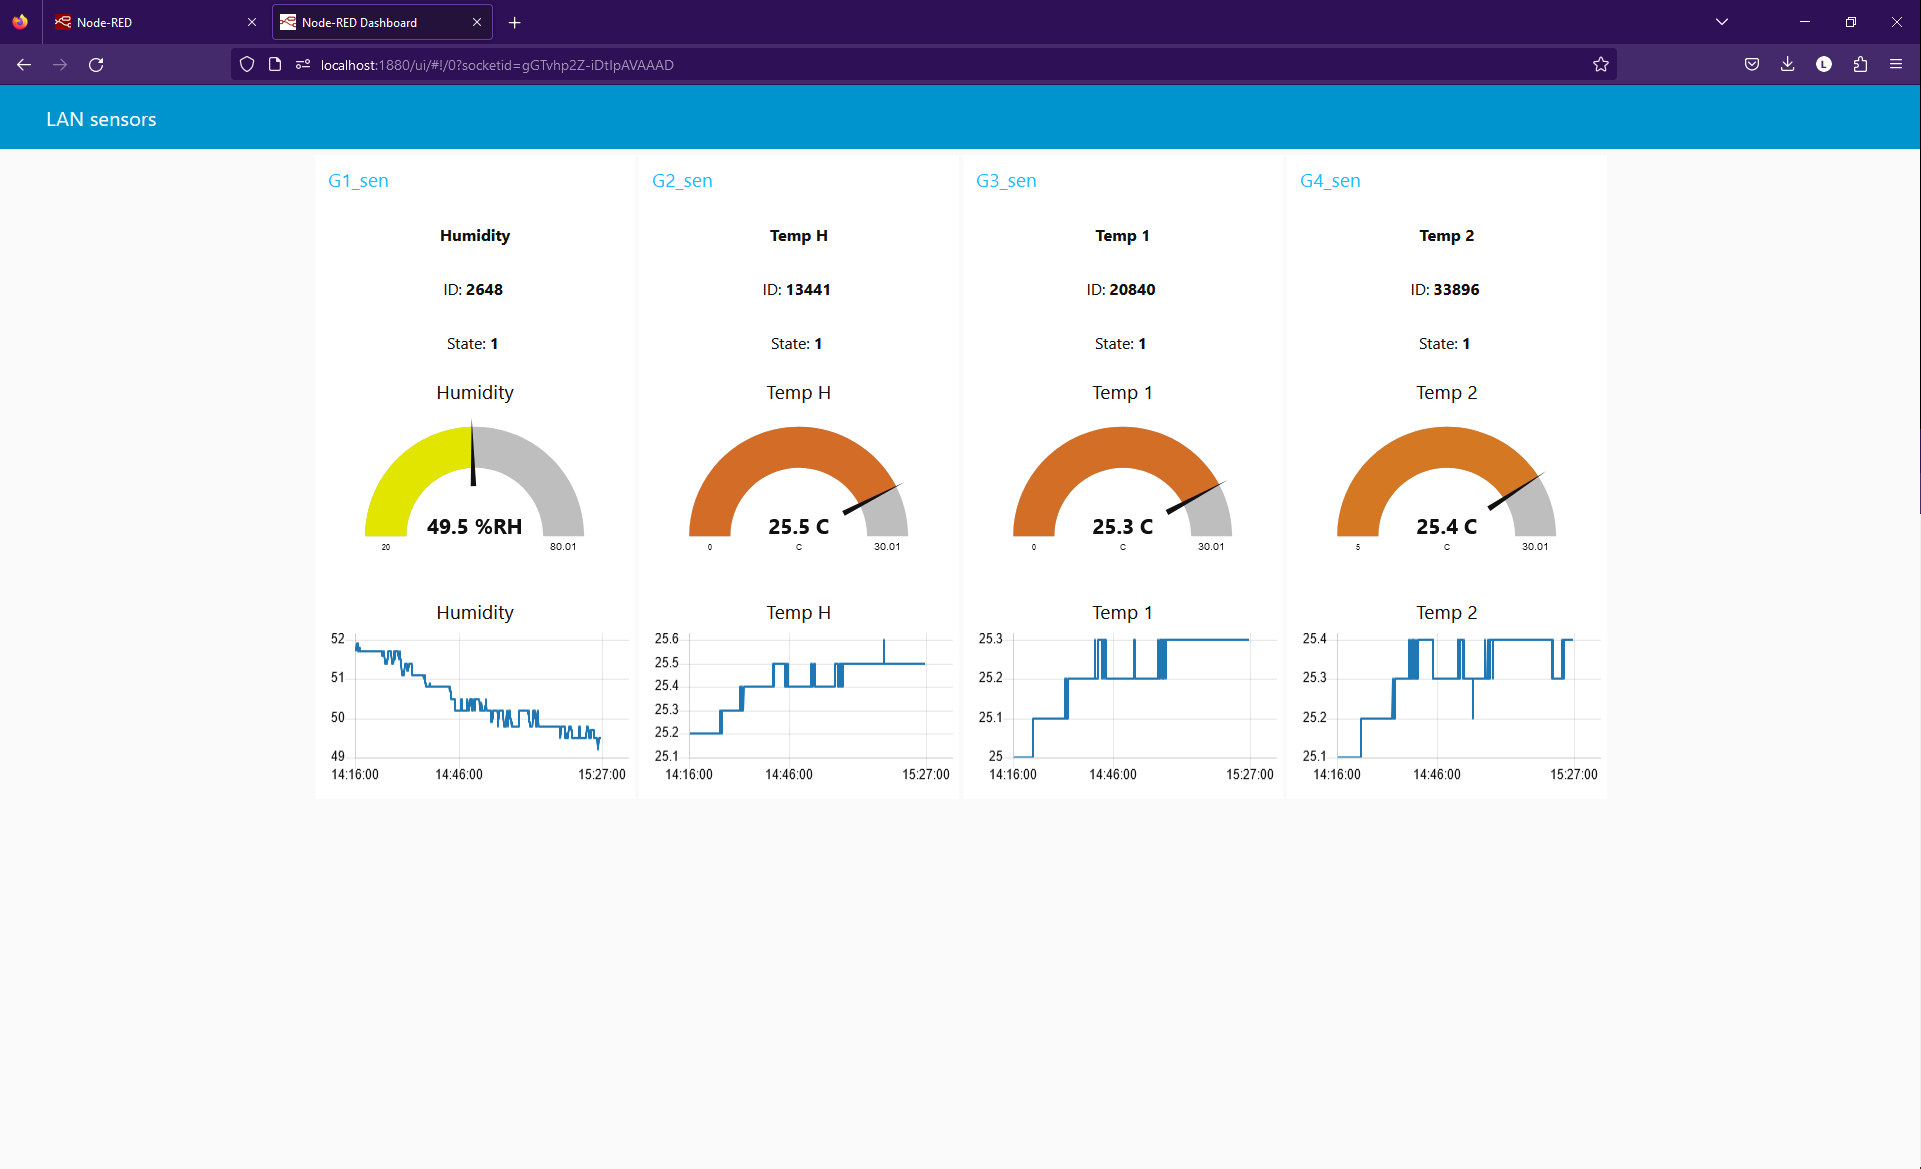
HWg-NR1 Dashboard
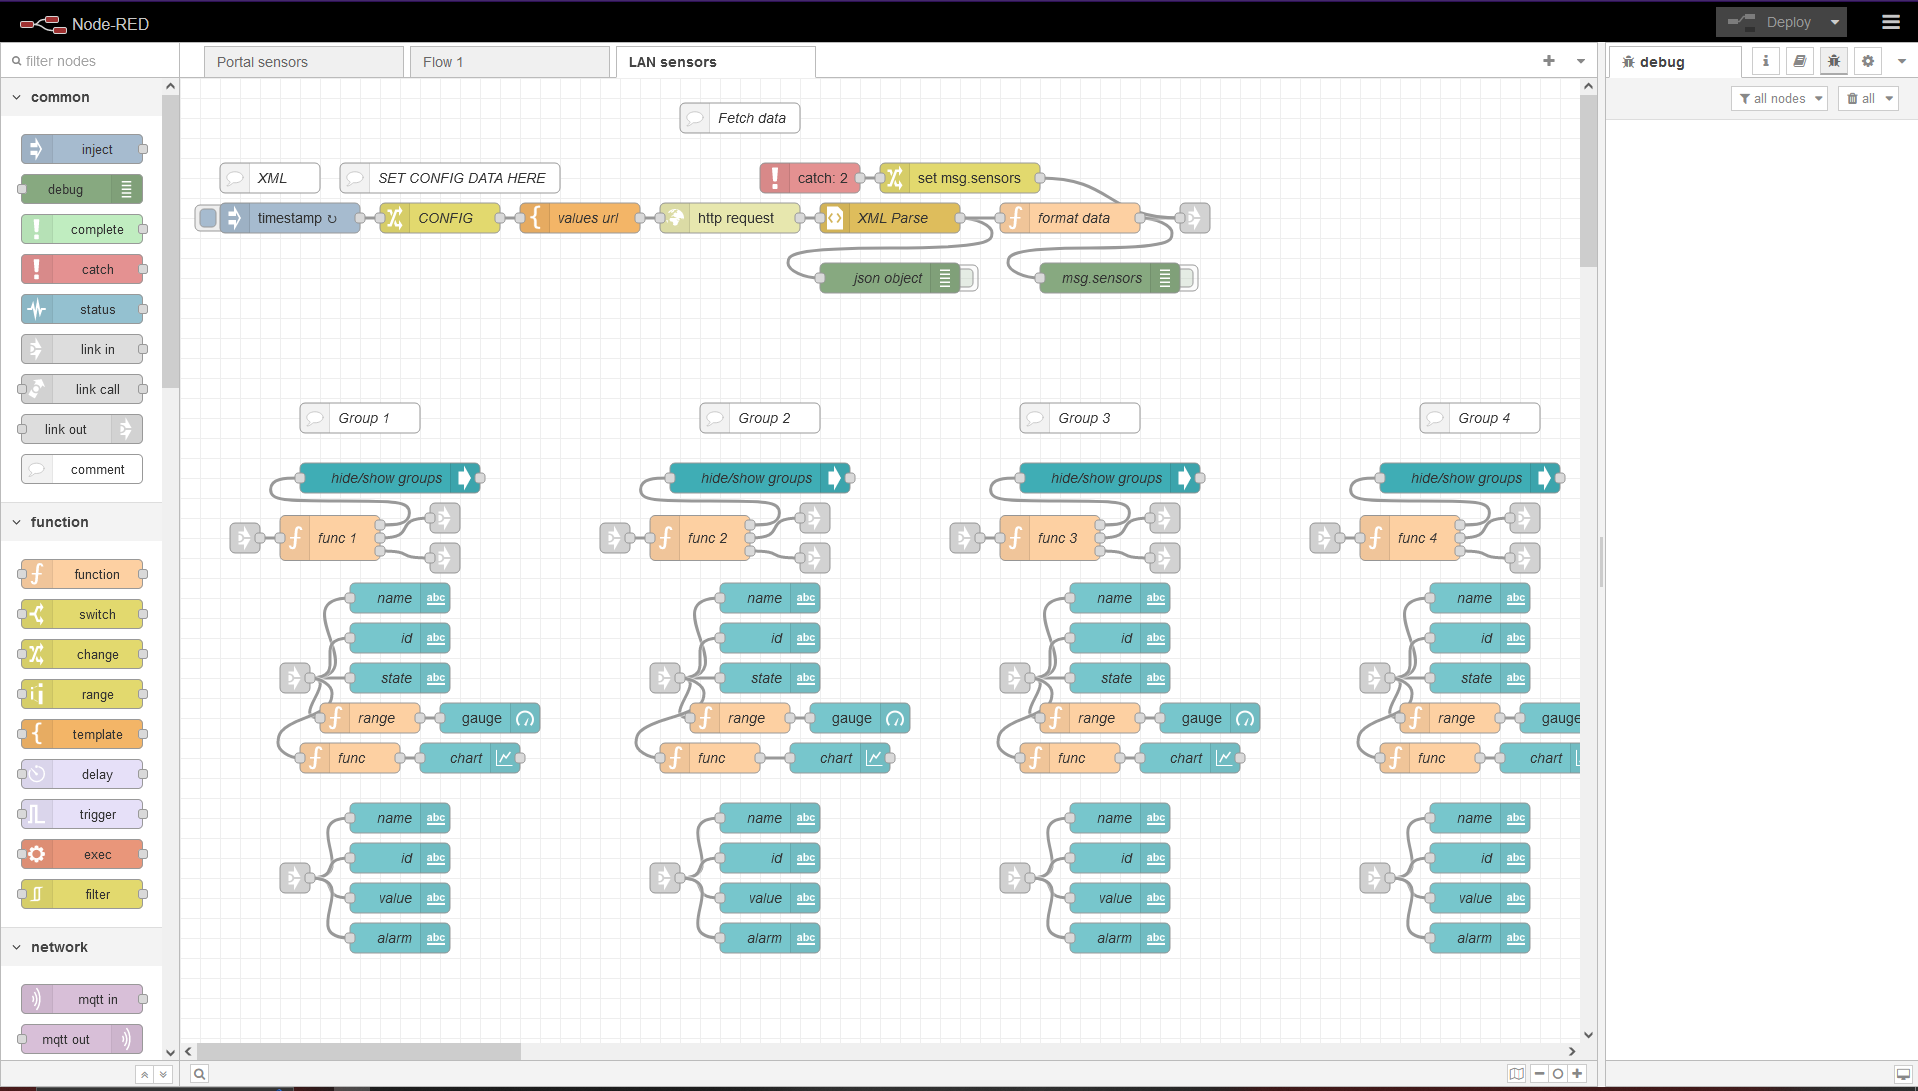
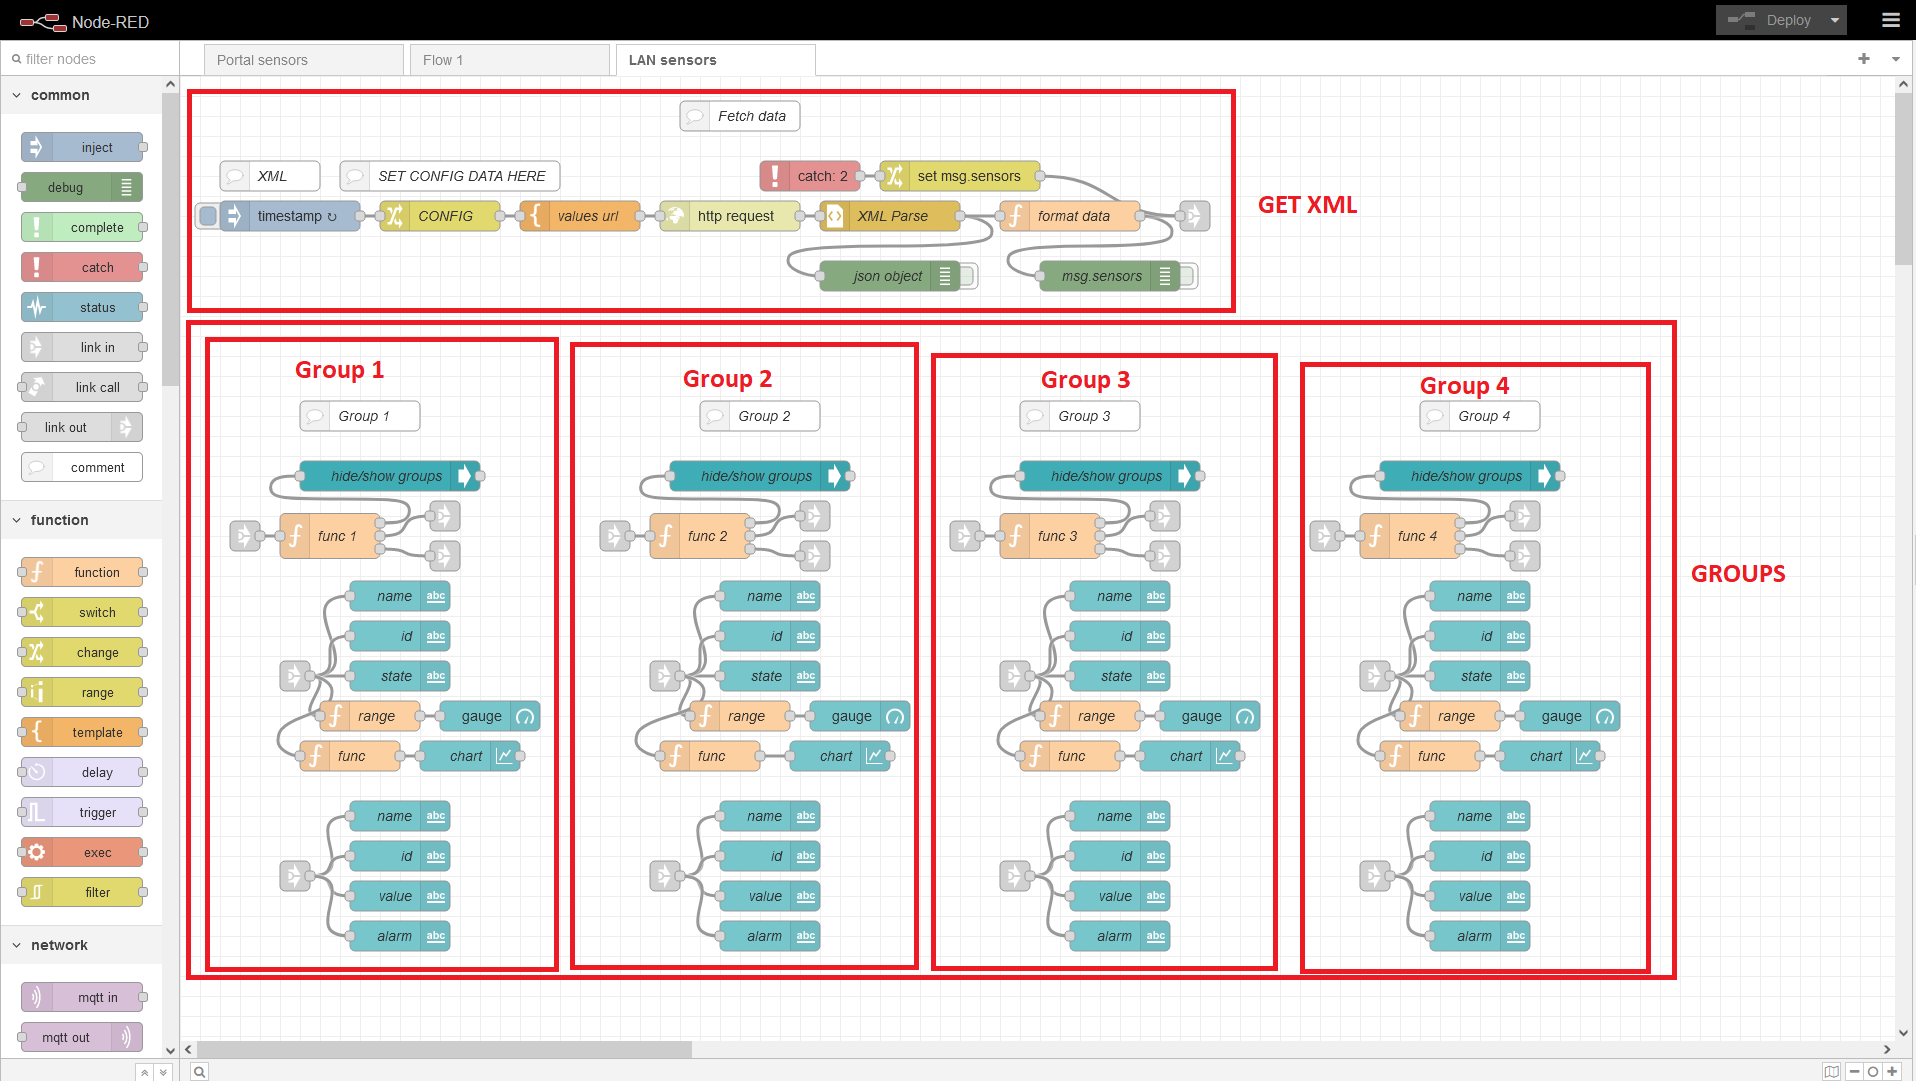
HWg-NR1 Node-RED Flow
Simple Deployment
To utilize the HWg-NR1 example, first you need to download and install Node-RED module. You can refer to https://nodered.org/docs/getting-started/ for more information.
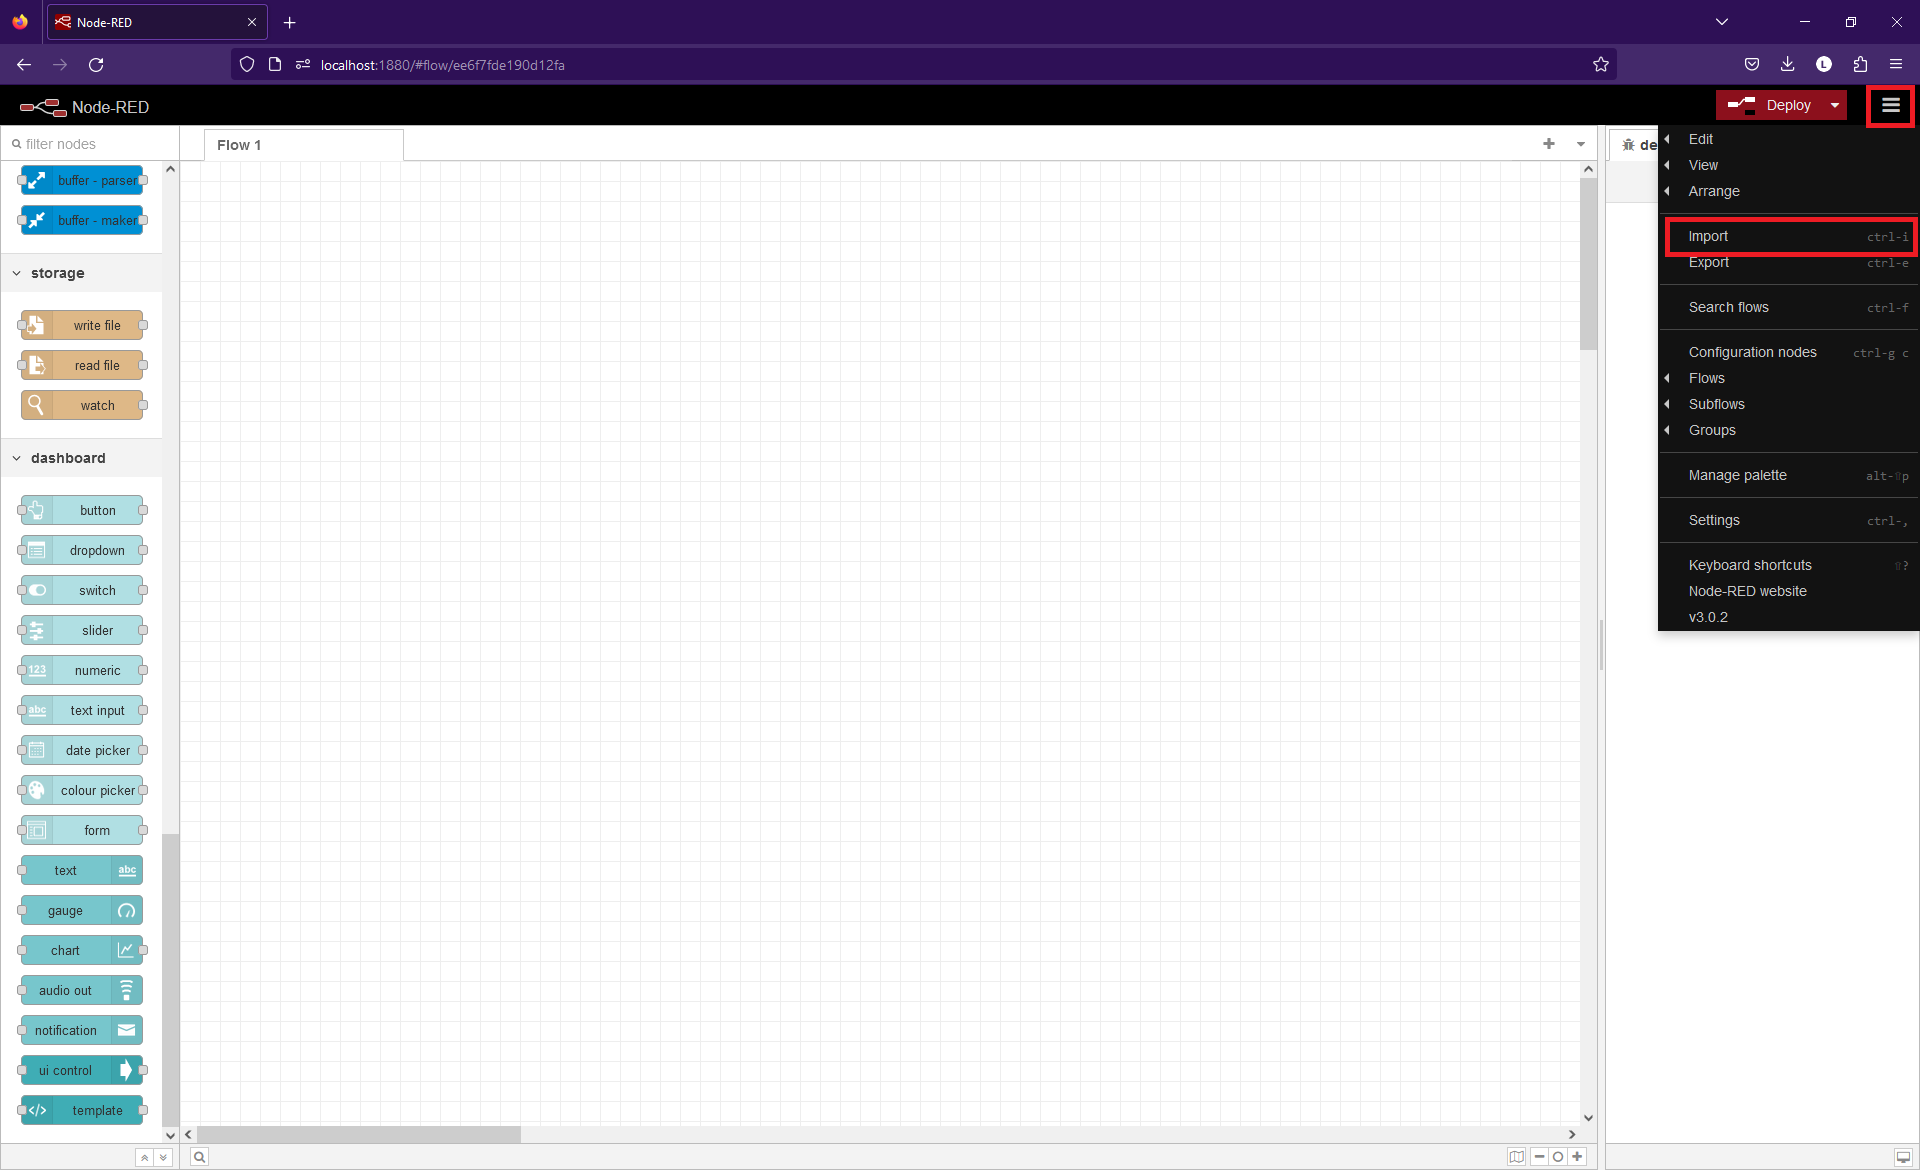
Once you have Node-RED running in the browser, click the hamburger menu in the top right corner, go to “import”, paste in the (don’t forget to change file extension from .txt to .json) JSON of the HWg-NR1 example, which you can find here: https://www.hw-group.com/files/support/10808-hwg-nr1-node-red-ste2-r2-integration-example-lan/lanprojectsrc.txt and click “Import”.
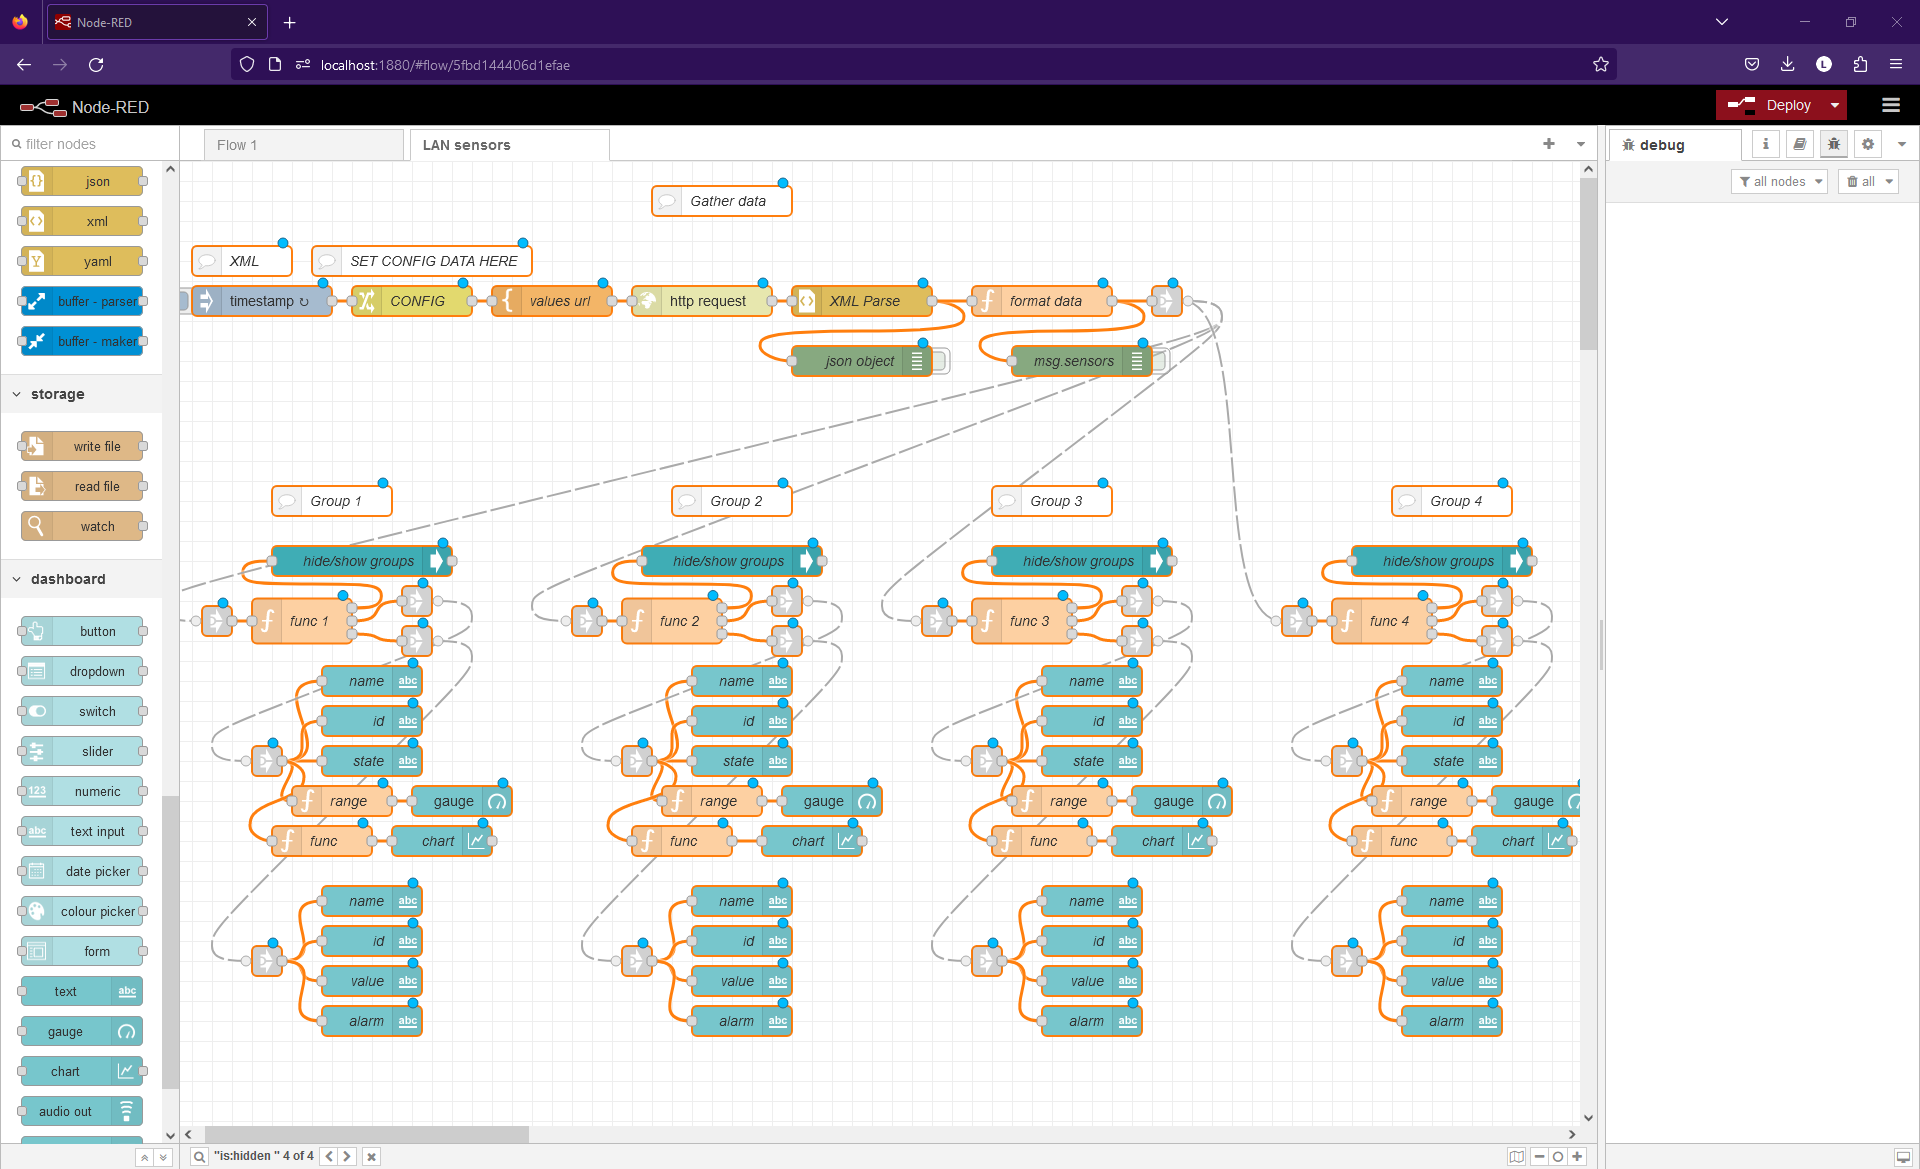
New nodes should now appear.
Before deploying the project, you must configure various parameters in the CONFIG node. Locate the node and double-click to display the UI on the right side of your screen with multiple options.
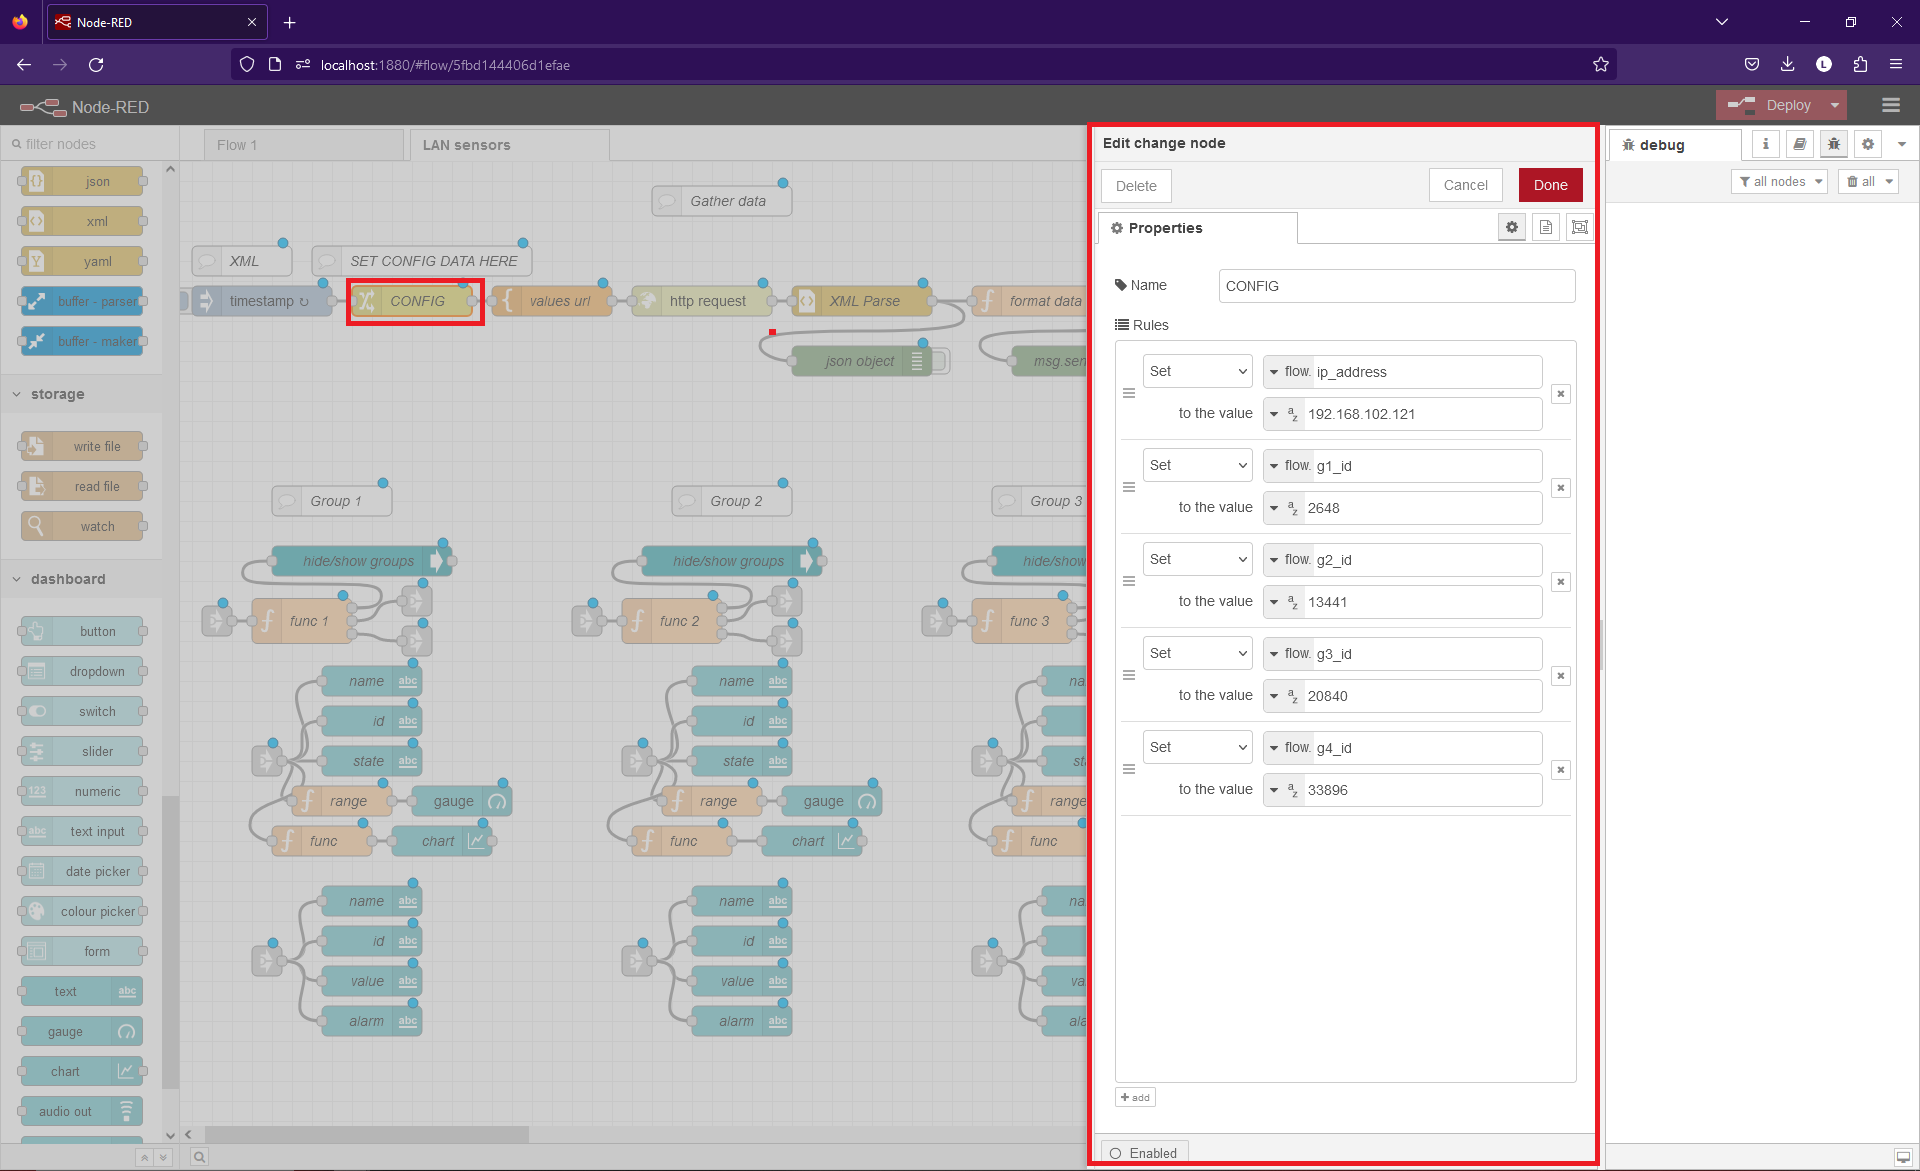
Change the value of the flow.ip_address to the IP address of your device.
The 4 following options (g1_id, g2_id etc.) correspond to the 4 groups in the UI. Each value represents the ID of the sensor which will be displayed in that group. Adjust the values of these 4 options and click “Done” in the top-right corner.
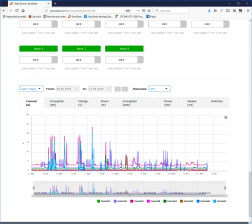
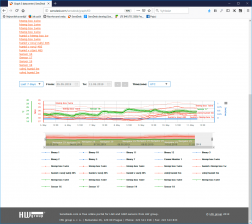
Click “Deploy” in the top right corner and press Ctrl + Shift + D to go to the dashboard. You should see something like this:
Detailed Walkthrough
The flow is split into 2 sections: GET XML, and GROUPS (which is then further split into: Group 1, Group 2, Group 3, and Group 4).
Section 1: Get XML
This part fetches the XML file, converts it to a JSON object and passes it to the four Group sections.

The Inject Node
Starts the flow every 3 seconds (in this context, a flow is a series of connected nodes).
The Change Node (“CONFIG”)
Saves the IP address and sensor IDs that should be in each group. The data is saved to the ‘flow’ scope (the tab in this context), meaning it can be accessed anywhere in this flow (by any node in this tab). The user inputs this data.
Template Node
The Template node creates the url to get the XML file and saves it msg.url, which can be accessed by the Http Request node.
Http Request Node
Fetches the XML from the device. The url is fetched from the msg.url property automatically.
XML Parse Node
Converts the XML string to a JSON object.
Function Node (“format data”)
Creates an array (msg.sensors) of the sensors and digital inputs. Each sensors/digital input is a JavaScript object with properties including the name, ID, and state.
Catch Node
Catches errors from the http Request and XML Parse Nodes. Used when the device is disconnected.
Change Node
Sets the msg.sensors property to an empty array which will result in “INVALID ID” name in the dashboard.
Link Out Node
Sends out the msg object to the groups. Link nodes function as a sort of tunnel. The msg object is sent out from the Link Out node and is received by the Link In node. It is used to make the flow more readable.
Section 2: Groups
Link In Node
Get the msg object from the Link Out node.
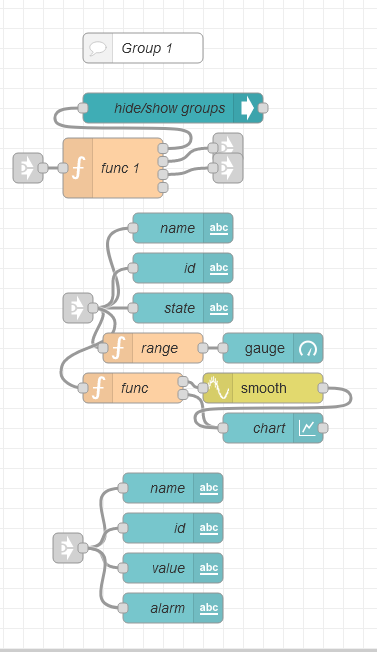
Function Node (“func 1”)
Grabs the data for the correct sensor/di (in respect to the ID specified in the CONFIG node) and checks if the value is reasonable.
If the value is above -100, a copy is made and saved to flow.g1_dat and relevant information gets parsed into individual sensor/di properties (e.g., sensor.name).
If the value is below -100 (indicating a disconnected sensor) the input (msg.sensors) is ignored and data is loaded from flow.g1_dat until the sensor is found again or the ID is changed in the CONFIG node.
The node has 3 outputs: msg, sensor, and di.
Msg output & UI Control Node (“hide/show groups”)
The node is responsible for hiding/showing either the sensor or di group (G1_sen or G1_di).
Sensor output
Connects to the individual UI elements through a pair of link nodes (these elements are only visible if the group ID corresponds with a sensor).
Text Node (“name”, “id”, etc.)
Displays text in the dashboard. In this example the name, ID, and the state of the sensor.
Function Node (“Range”)
Parses the min, max, value, and name properties for the Gauge node connected to it.
Smooth Node
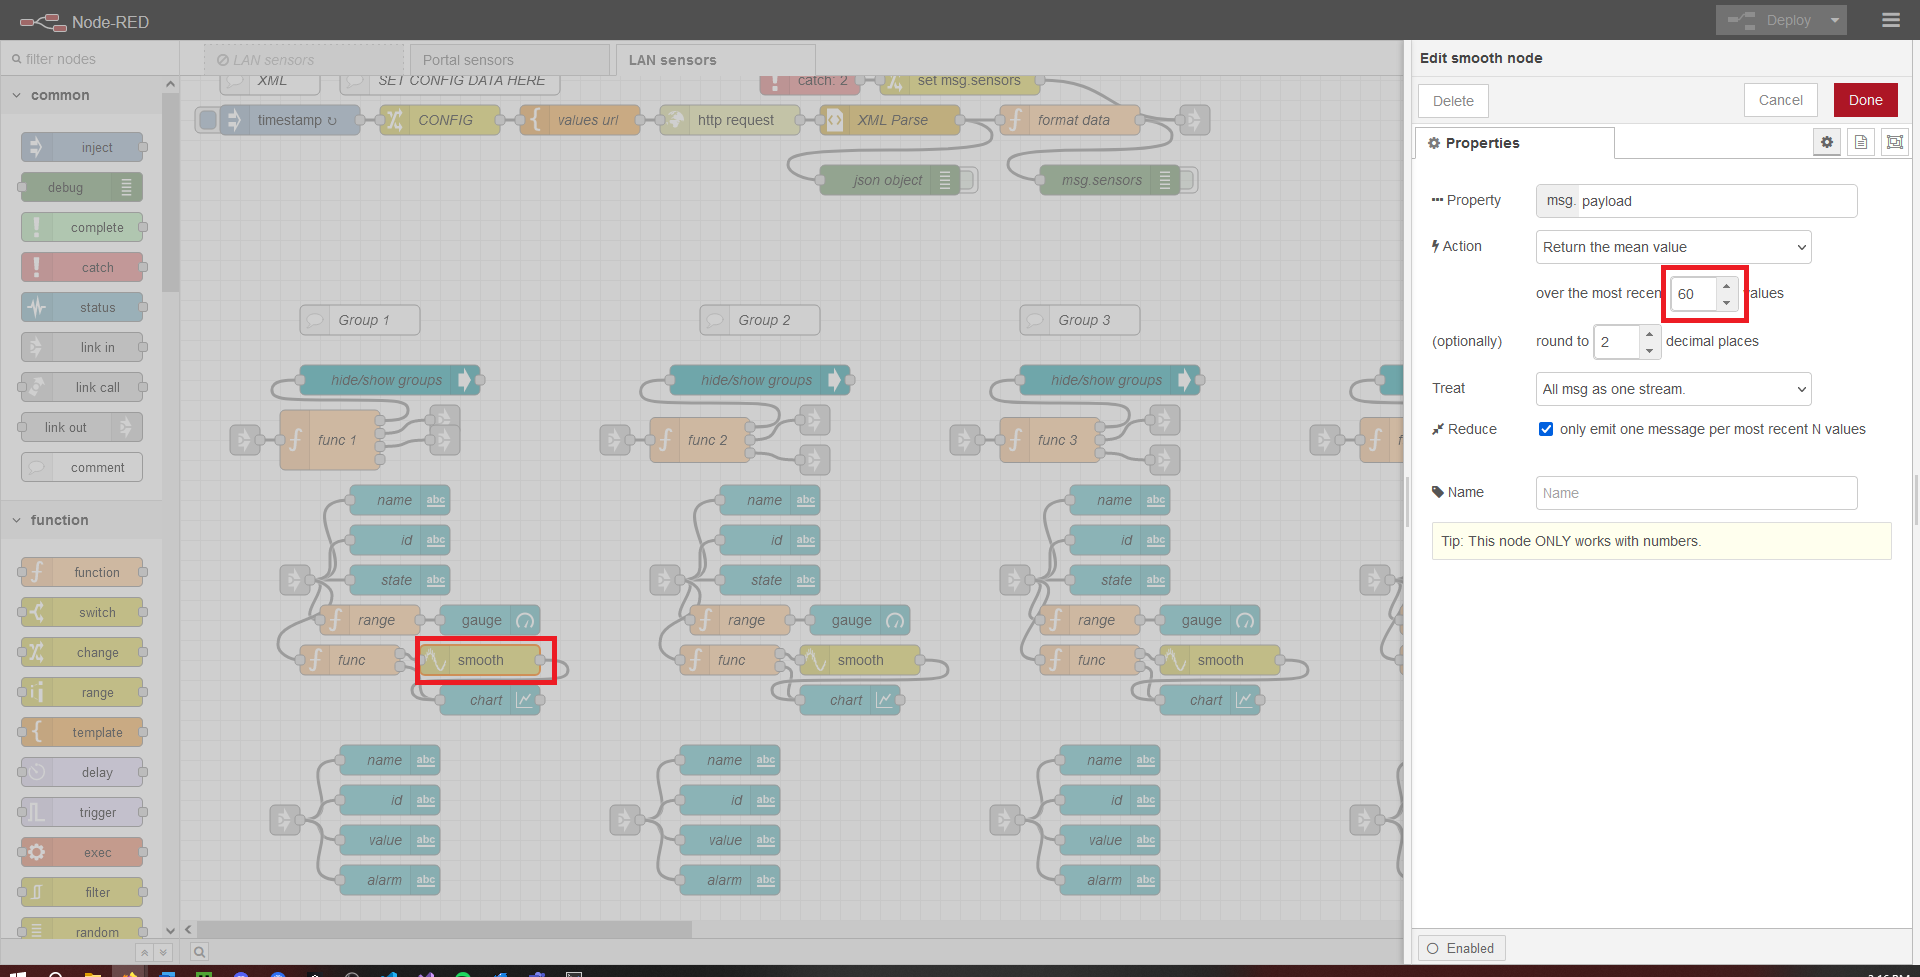
Creates of the mathematical average (mean) of the past 60 values (can be changed). This ensures reliability of the application.
Gauge Node
The gauge displays the current value of the sensor in the dashboard.
Function Node (“func”)
Resets the following Chart node by sending an empty array as the value if the ID has been changed (checked for in the “func 1”).
Chart Node
Displays a chart of the value in the dashboard. The time span is 1 week but it can be changed in the chart settings menu (long time spans are not recommended due to the risk of the RAM overload).
Di output & Text Node
Displays text in the dashboard. In this example the name, ID, and the value (0 or 1) of the digital input and the alarm state (0 or 1).
Notes and Disclaimers
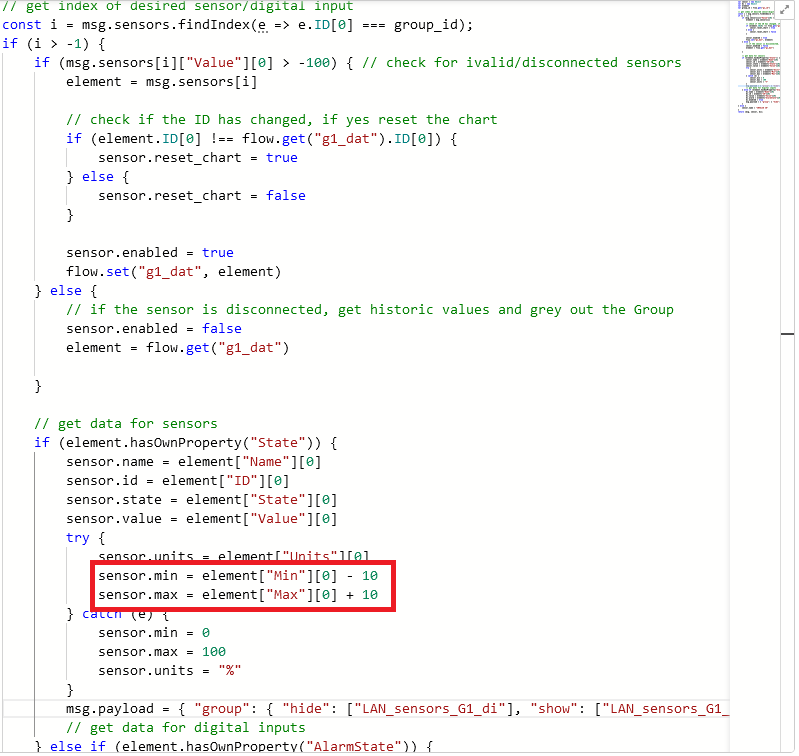
Gauge min & max
The values for the gauges in the UI are calculated from the Safe Range values with an extension of 10, meaning that if the Low Safe Range is 30 the min. for the gauge is going to be 20. This can be changed in the functions of individual groups.
Adding a new Group to the dashboard
Adding a new group to the dashboard may be challenging and time-consuming but it is still achievable.
1) Copy-paste one of the groups;
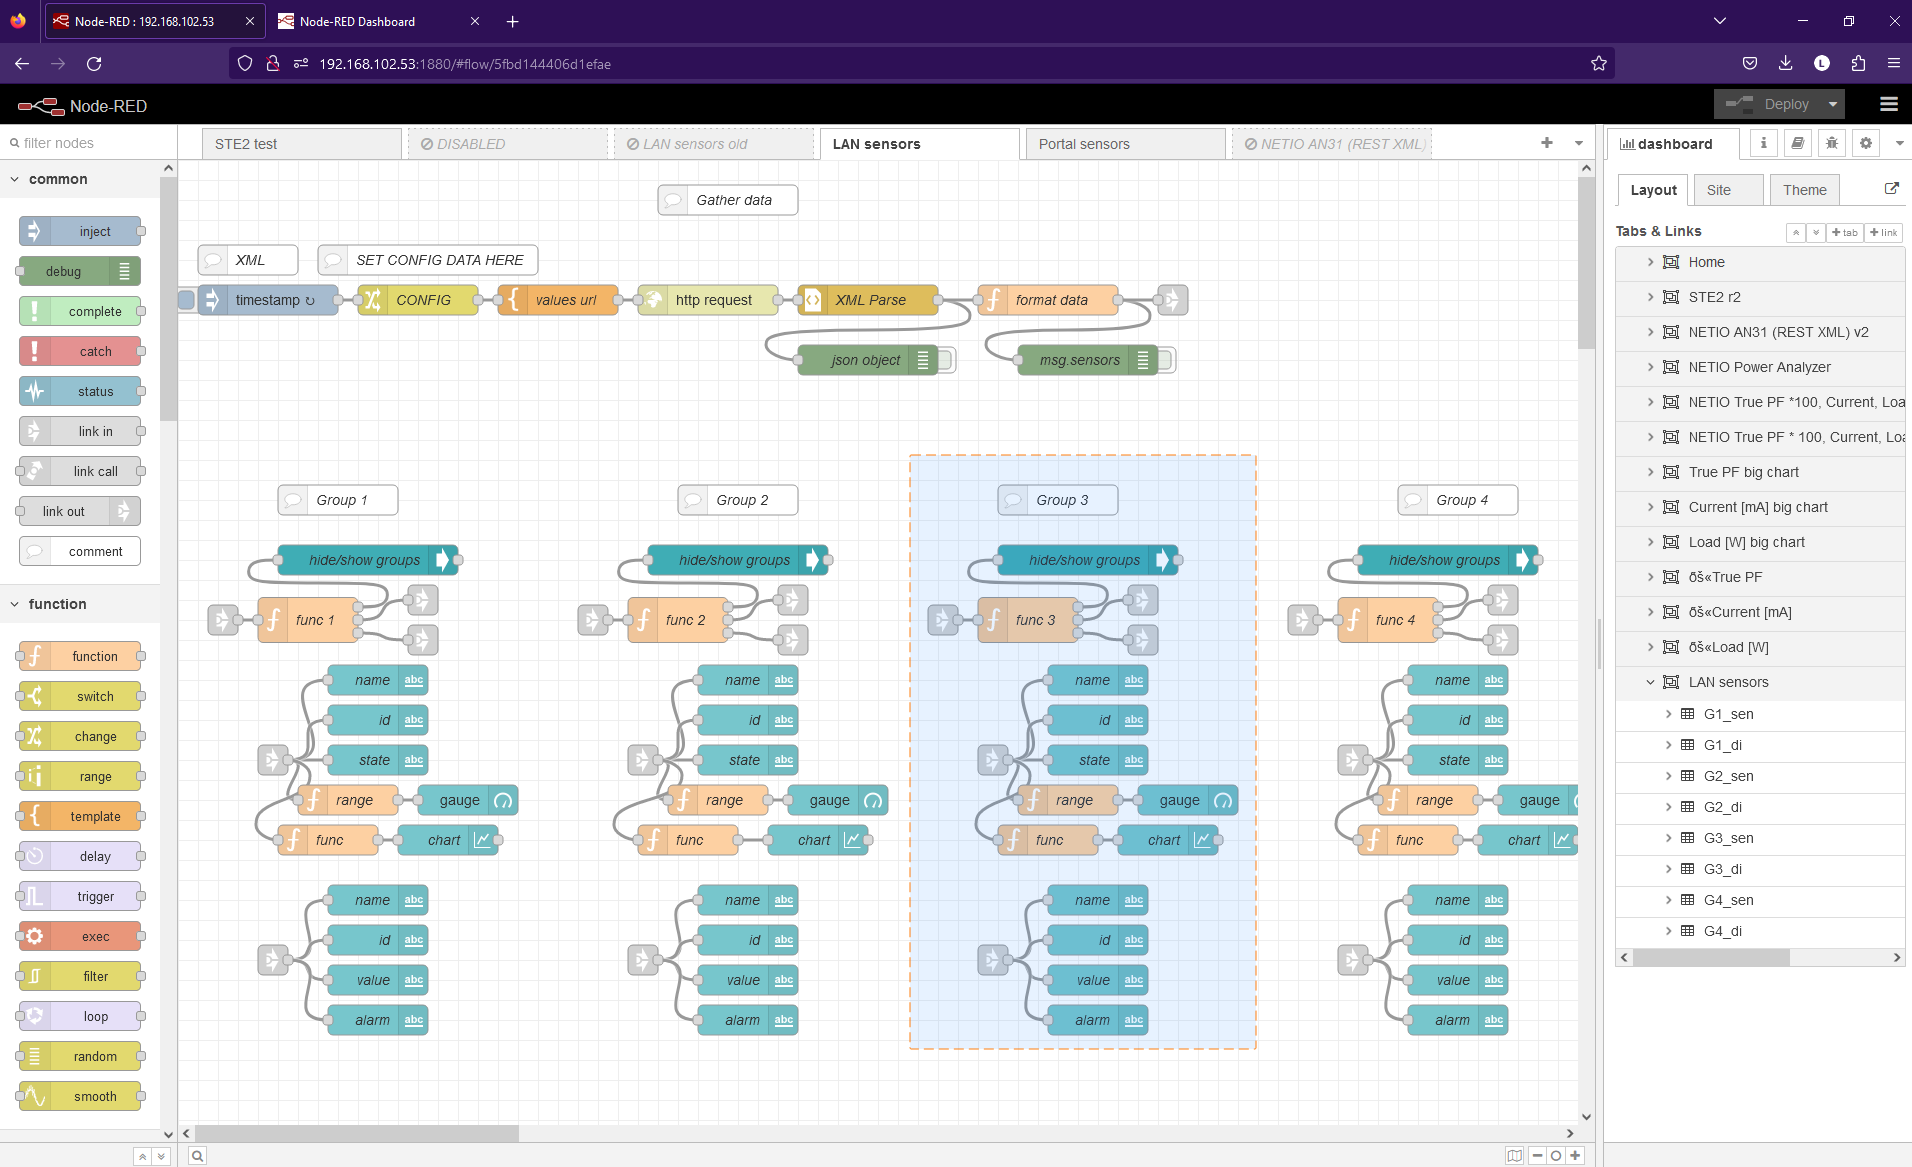
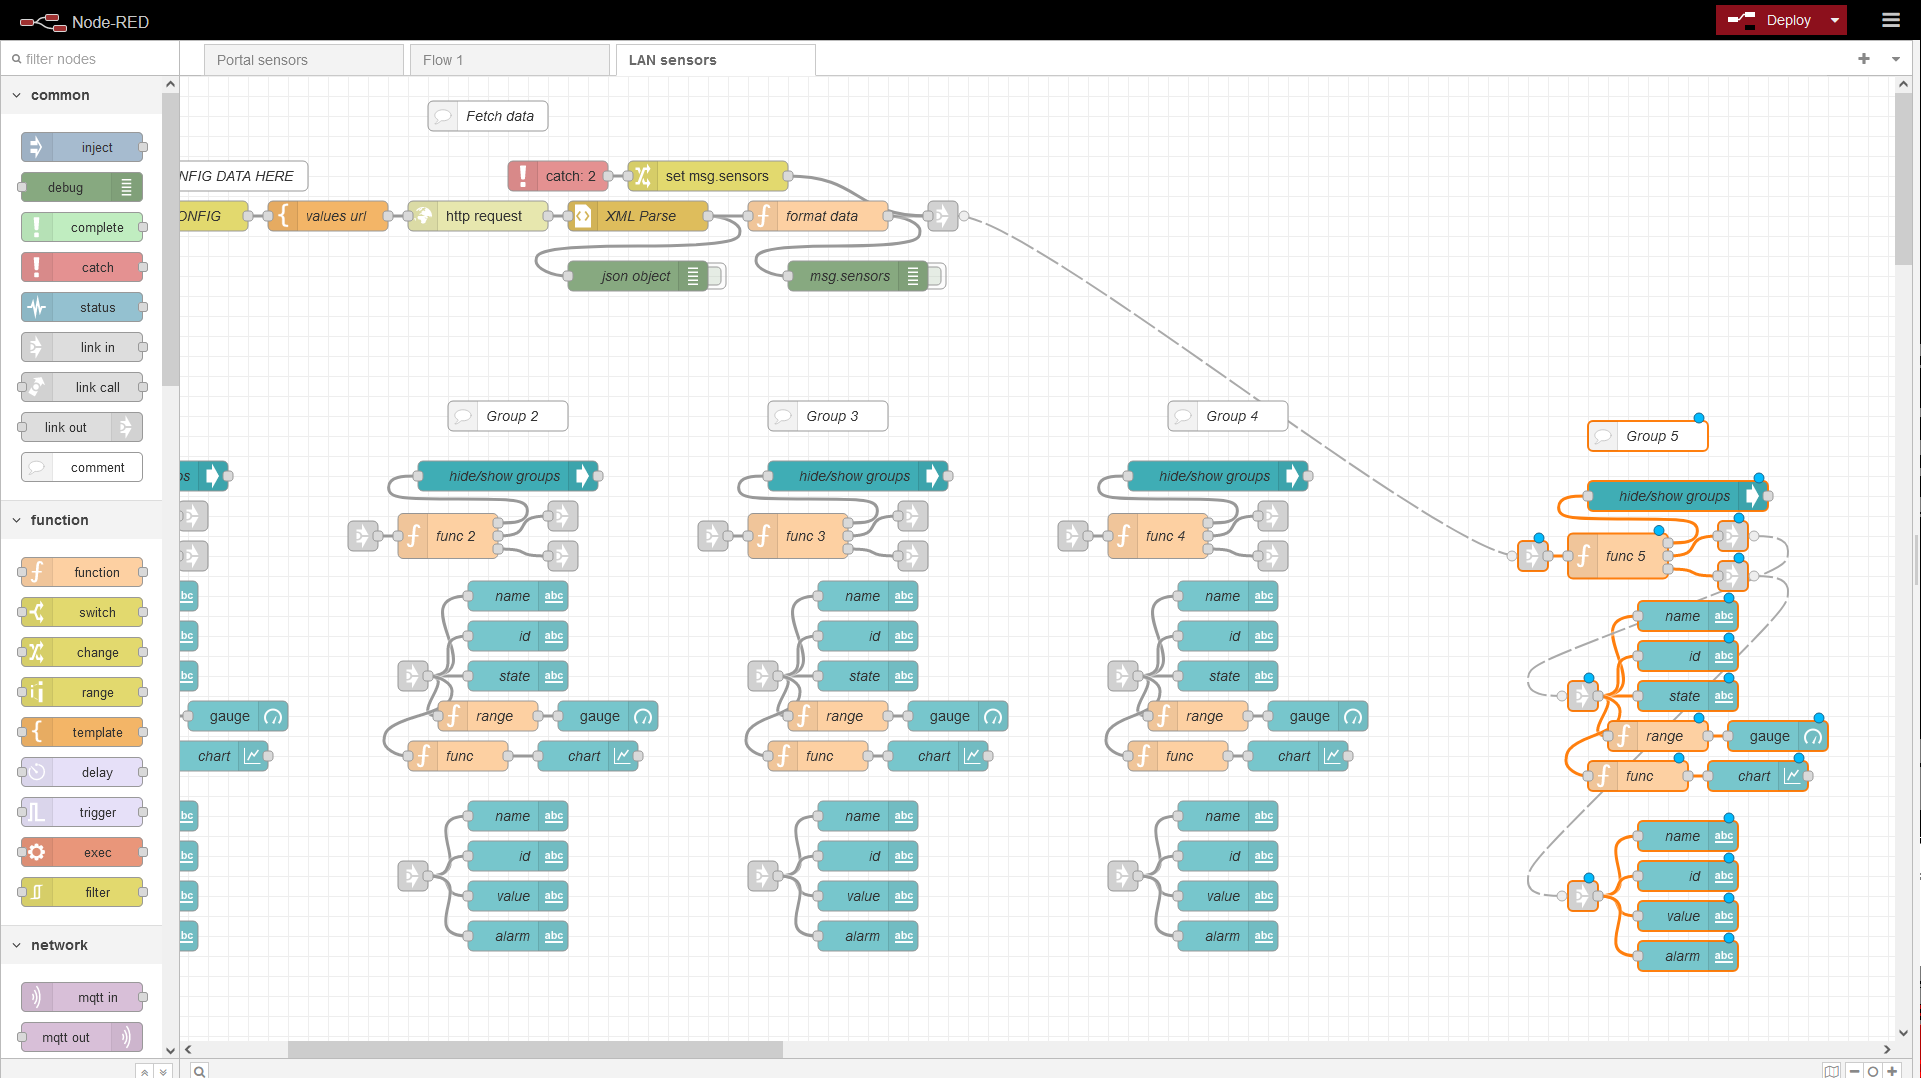
2) To keep things clean, change the number in the comment and the function (e.g., func 5);
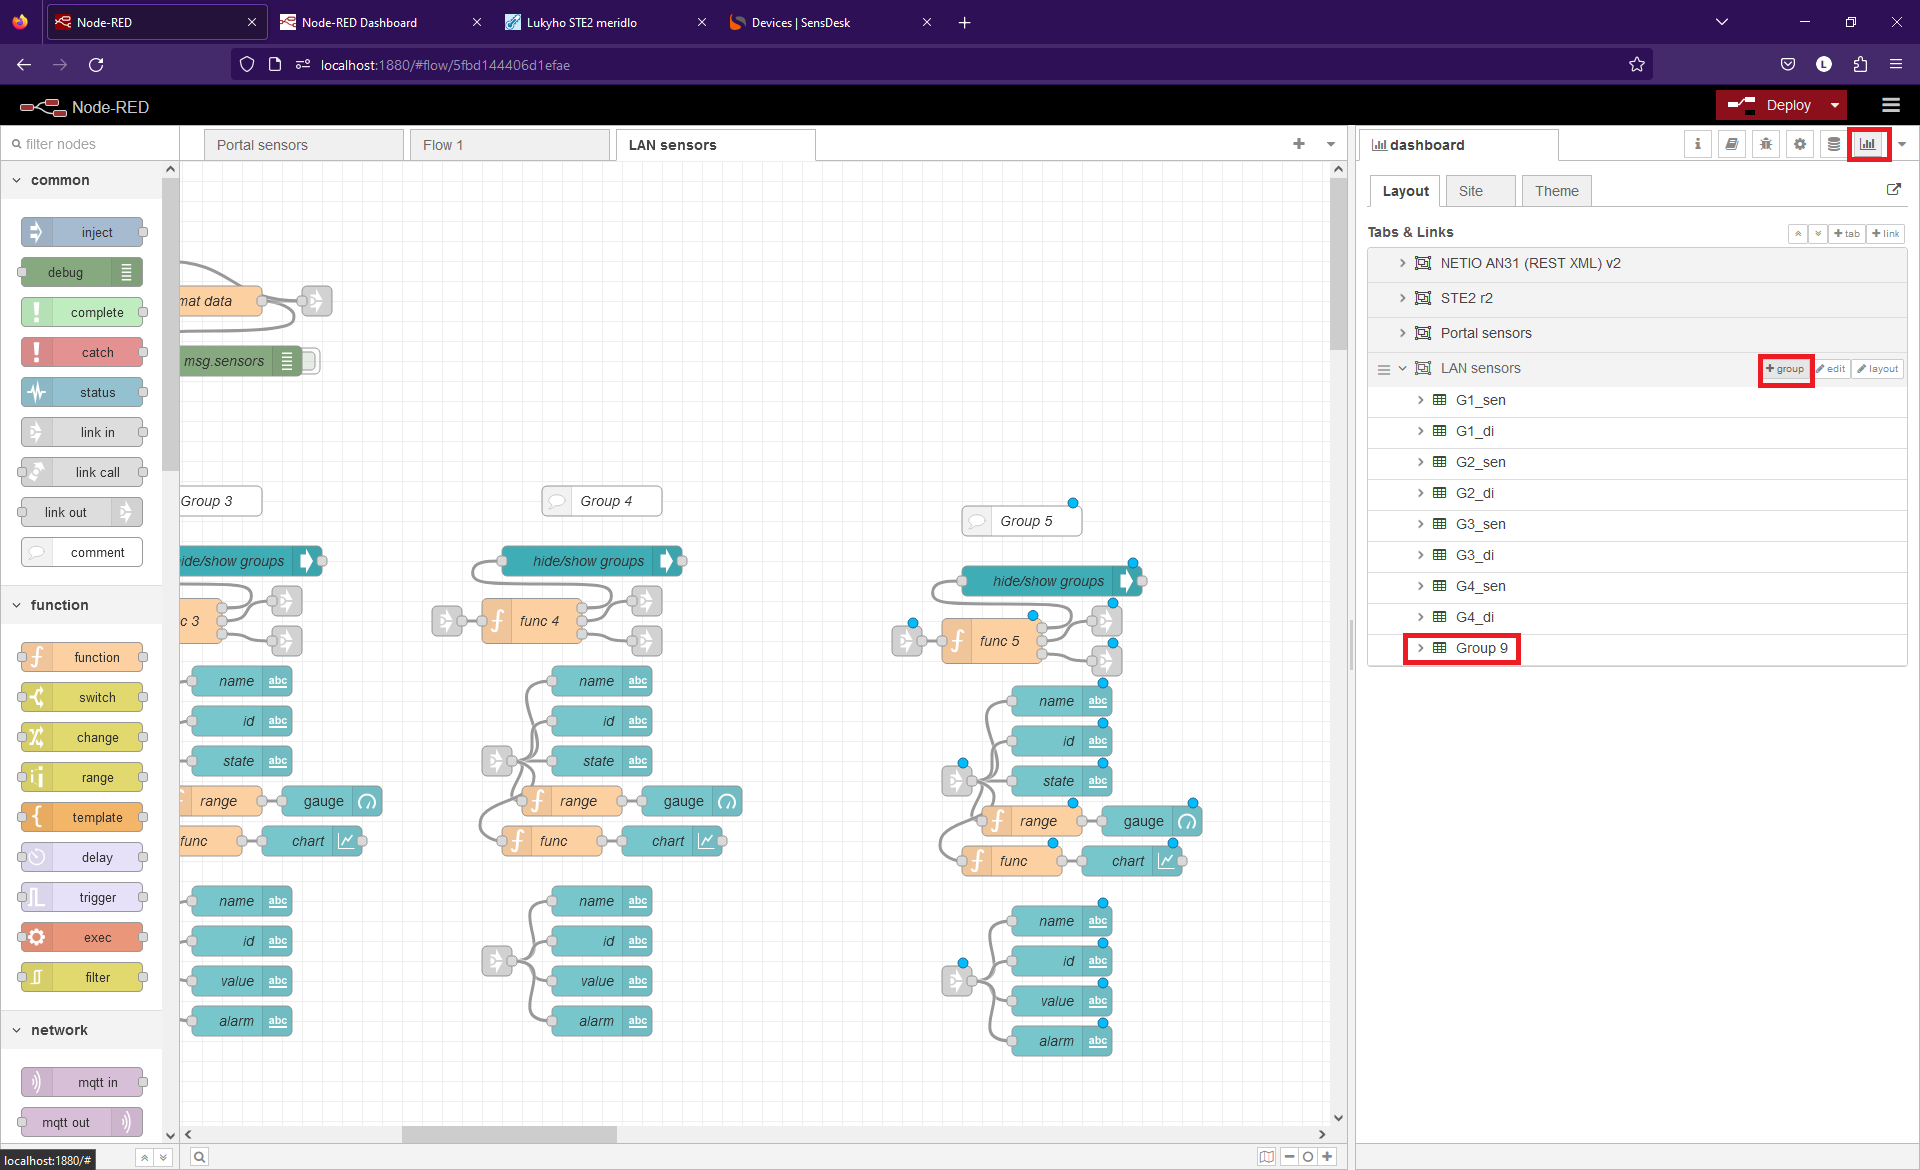
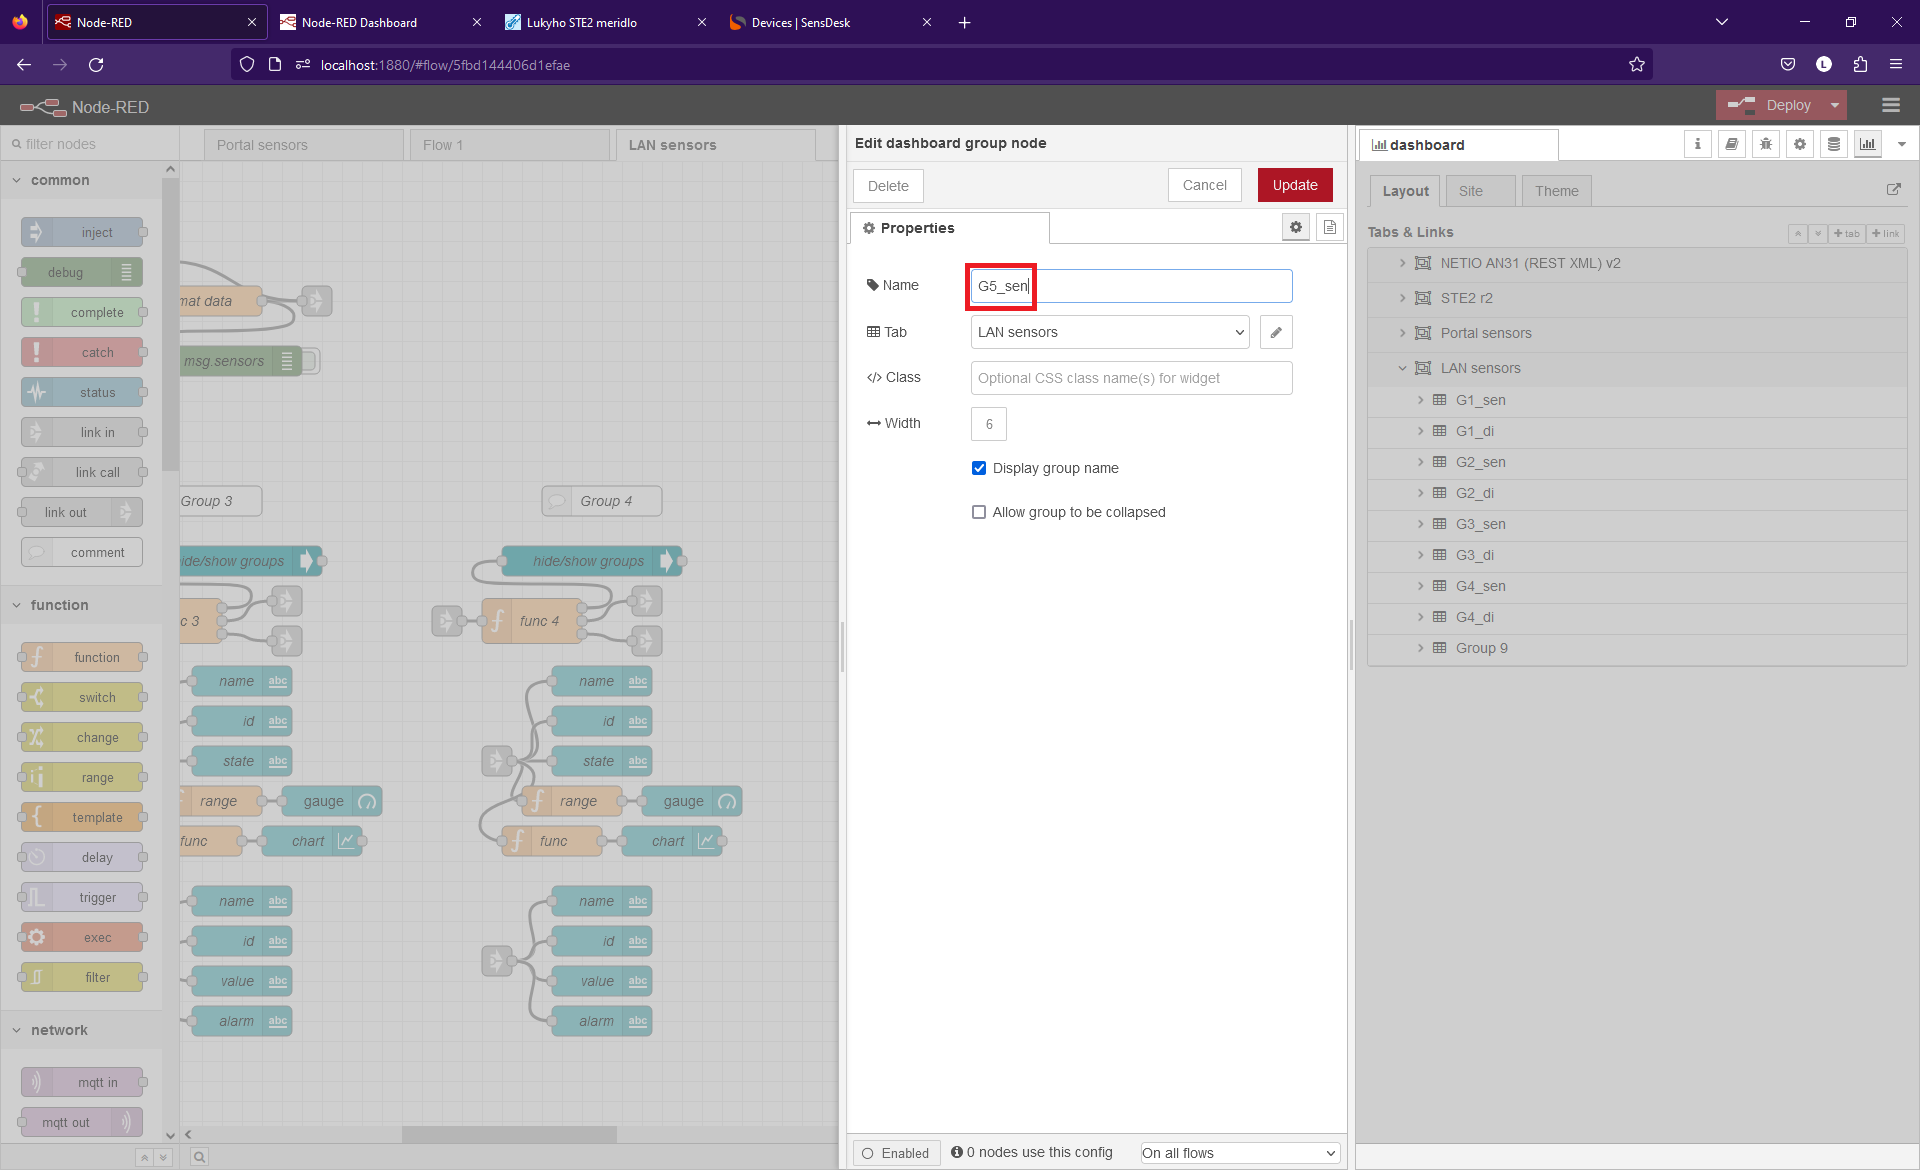
3) In the sidebar, navigate to the dashboard tab and then to the LAN Sensors tab and create 2 new groups. Click ‘edit’ and change their names to G5_sen and G5_di (or the corresponding number);
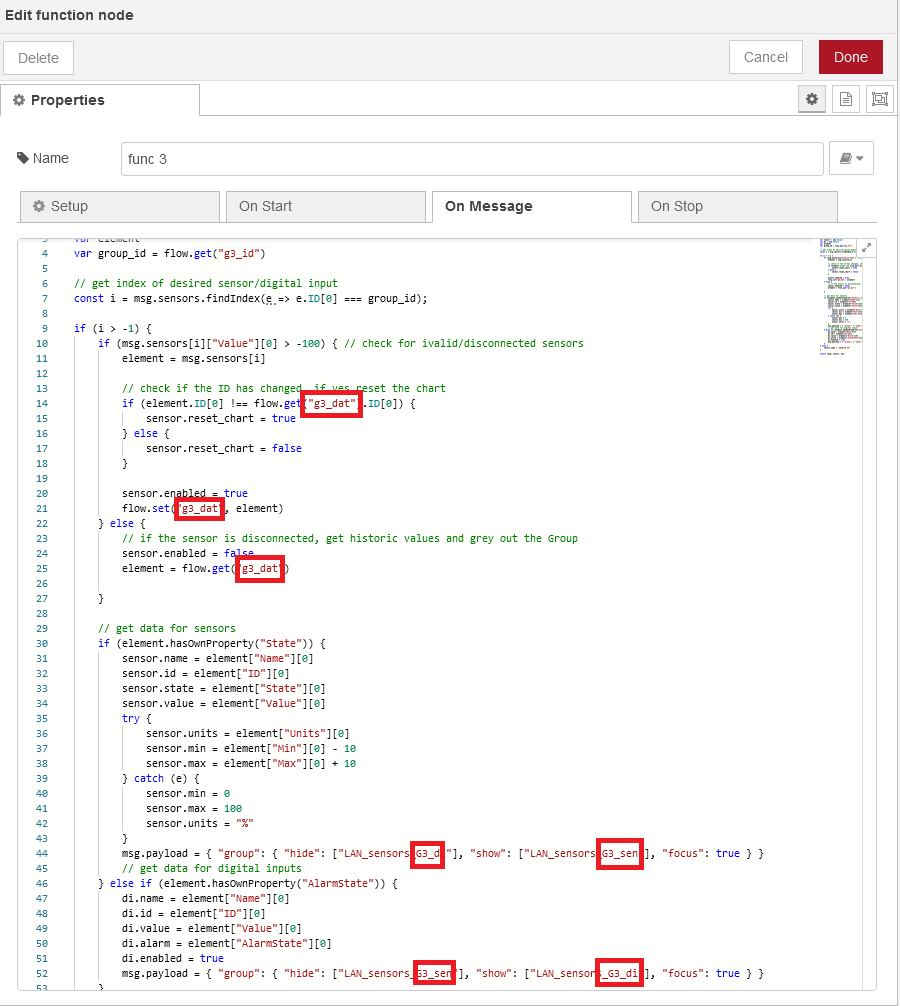
4) In the “func n” node, change all of the following numbers to the relevant one (if you are creating a fifth group all the numbers should be changed to a 5);

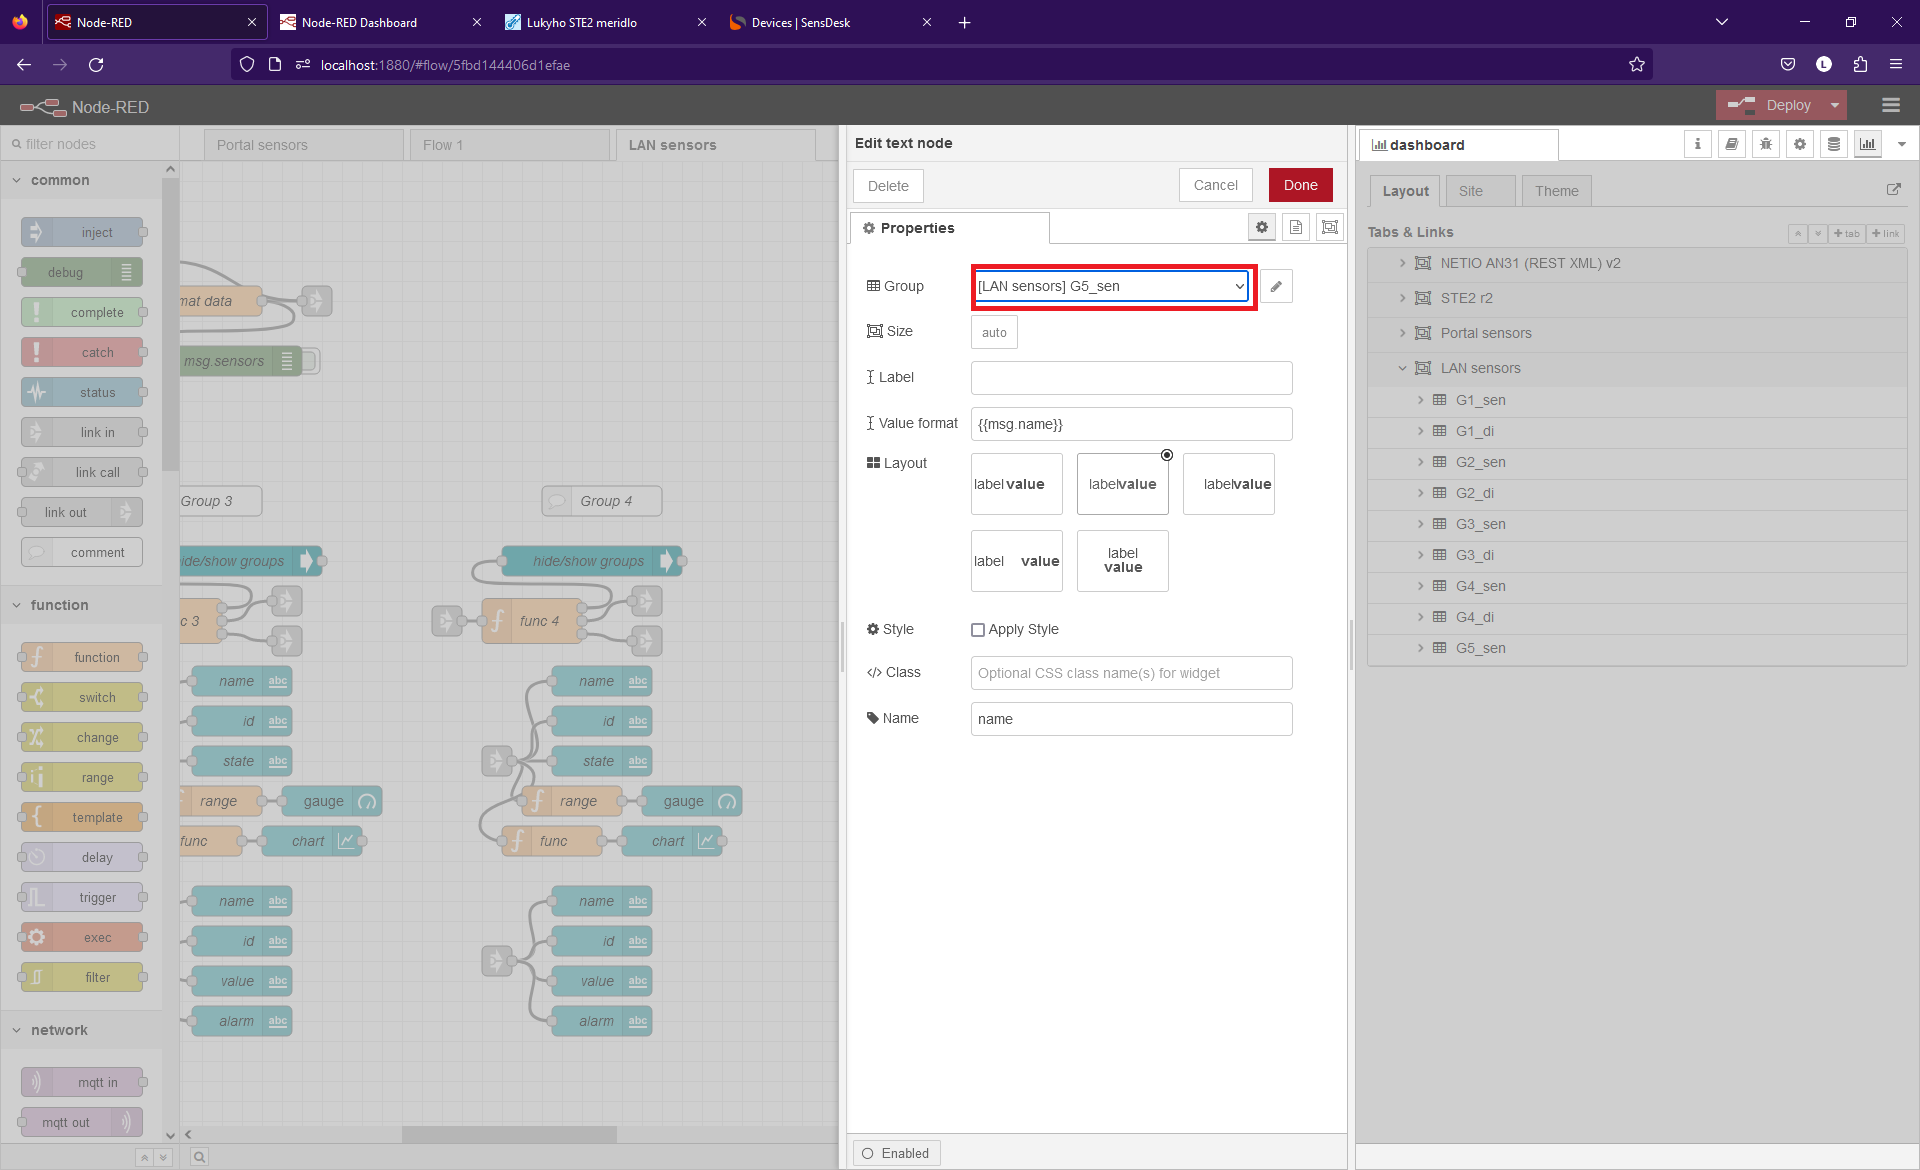
5) Now the tedious part. Go through all the UI nodes in the new group and change the dashboard group to the either of the two you have just created (keep in mind that there is a group for the sensors – G5_sen and a group for the digital inputs – G5_di);
6) Congratulations, you have just created a new Group for the dashboard.
Resize Groups
You can change the width of the groups to fit to a smaller/larger display, individually in their edit UI.
More data points on the graph
If you want your graphs to have a different data point density, you can change the action value in the Smooth Node. The default is 60 -> a new data point is added to the graph every 3 minutes. If you wish to change this, please bear in mind that can cause RAM overload and cause the application to crash.
Adding Another Device
1) Add a new property in the Change Node (“CONFIG”) to the Flow scope and name it ‘ip_address_2’ and set the value to the desired IP address;
2) Select all the nodes between the Template Node and the Function Node (“format data”) (inclusive) and copy them;
3) Delete the link between the Function Node (“format data”) and paste your selection between these two nodes (you will have to move the link node);
4) In the new Template Node, change the ‘flow.ip_address’ to ‘flow.ip_address_2’;
5) In the new Function Node (“format data”) delete the “msg.sensors = []”;
6) Delete the new Change Node (“set msg.sensors”);
7) In the new Catch Node make sure the two new Function and XML Parse Nodes are selected and connect it to the Link Out Node;
8) Connect the old Function Node (“format data”) to the new Template Node and the new Function Node (“format data”) to the Link Node;
9) Your flow should now be looking something like this:

