The need to verify the authenticity of measured data arises with any kind of measurement. Take the example of cleaning logs at public restrooms: we have all seen examples of missing records, or of log sheets pre-filled for several hours in advance. This is the human factor, and it is no different with measurements. To be assured that a temperature or another measured quantity has not exceeded the allowed range (e.g. to prevent spoiling of goods, damage to technology, or energy waste), the only correct solution is independent electronic monitoring with data acquisition systems or data loggers. Moreover, in order to demonstrate compliance to third parties, such as to the respective authorities in the pharmaceuticals or food industry (think HACCP), it is necessary to provide both the measured values as well as a proof that they have not been tampered with. This can be done with various special solutions, and the SensDesk portal is now one of them.
With the portal, it is possible to select sensors that will be included in a periodic (daily, weekly, monthly) e-mail report. In a PDF file, the report provides a chart as well as a list of times when the safe ranges were exceeded. Before sending, the portal digitally signs the file with a trusted certificate to guarantee the integrity of the data. And since SensDesk does not provide any data manipulation interface, this output also proves the authenticity of the data.
Basic features of the portal reports
- Simple creation and configuration
- Multiple sensors from several devices can be included
- Sent daily, weekly or monthly
- E-mail with a digitally signed PDF attachment
- PDF with a chart of all values and a list of all cases when the SafeRange of a value was exceeded or the Device Invalid or Sensor Invalid state was detected
- There is a limit on the number of different reports per team. Users can create their own reports.
- Rights to create and edit reports are restricted to Report Admin and Team Admin
The main advantage of the portal solution is its simplicity. You don’t need a computer or server to run 24/7 and collect data, learn to work with new applications, and worry about actually having the data. You simply configure the device to send data to the portal, create a portal account, and then select the sensors to include in the report and specify how often you want to receive it. If a device stops communicating with the portal, the service can be configured to send you an e-mail or a text message (SMS) so that you can react to the problem without delay. Of course, SensDesk offers much more. For details, see https://www.hw-group.com/software/sensdesk or try it out using a Demo account at https://sensdesk.com.
Configuring reports in SensDesk
Reports are configured in the Settings / Reports menu.
Click the Create new report icon to open the editing page. Enter the report name (this will be the e-mail subject), periodicity, recipient’s e-mail address (it is possible to enter multiple addresses separated by commas or semicolons), and select the sensors or inputs to include in the report. The selection follows the same logic as in the Graph and similar functions: expand a device and highlight items to select them.
After saving, a confirmation is displayed and the report page is shown. There, you can edit the report settings and access a list of all previously generated reports, sorted by date and month.
To check the report, click Preview PDF. Depending on your browser, a generated PDF file is displayed in a new window or downloaded to your computer. However, please be patient, longer reports can take a few minutes to generate.
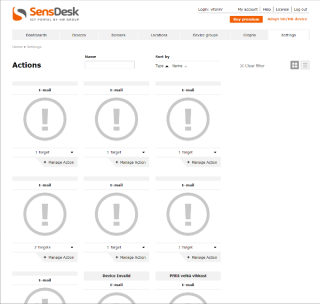
A list of predefined reports is available at the Settings / Reports page.
Overview of your daily reports
A pdf report of your chosen day
To see real examples of the graph go to log in to the portal as username “demo” and password “demo“.